The 2020 coronavirus outbreak has sparked severe shocks to the United States labor market. Social distancing policies, designed to slow the spread of the disease, are leading to large layoffs in specific industries, like bars and restaurants. Many more employees in other sectors face the prospect of unemployment or temporary furloughs. Despite this economic strain, employers, particularly those in Medical and Supply Chain services, are expanding to meet new demand. These sectors continue to post job opportunities long after policymakers mandated the closure of non-essential services or issued “shelter-in-place” orders.

Evidence from Texas over the past half-month reveals both predictable and unexpected trends in new job opportunities. It may come as a surprise that, even in this “lockdown economy,” there is still help wanted.

Beginning on March 18th, Texas began implementing statewide social distancing policies, though some areas began issuing such orders days earlier. Cities and counties across the state gradually adopted “shelter-in-place” orders in March.  By March 31st, a statewide order asked residents to stay home, except if they participated in “essential services and activities.”

But within the past two weeks, Texas employers posted over 66,000 new job openings.

Daily job postings are one indicator of up-to-date labor market demand, available from a variety of sources (most notably online).  The Texas Workforce Commission (“TWC”) is the state agency responsible for managing and providing workforce development services to employers and potential employees in Texas.  One service the TWC provides is access to databases of up-to-date job postings for different occupations and employers within the state. These job postings can come from the TWC itself, or from third party sites like Monster or Indeed. This information is extraordinarily valuable to data scientists.

The top 10 in demand occupations cover a variety of occupations, but are heavily concentrated in the healthcare, supply chain, and IT sectors.

Given the stresses to the healthcare system, its little surprise that hospitals are looking for more front-line staff. Registered Nurses were the highest in demand occupation, with over 3,000 new job listings since March 23rd.


Retail supply chains are also expanding employment.  Sales Representatives for Wholesalers and Manufacturers, with over 2,300 new listings, was the second highest in demand occupation. Other logistical occupations saw large numbers of new openings, particularly for Truck Drivers, with over 1,200 new job postings since March 23rd.

Anecdotally, supermarkets and retail chains have been hiring more employees to meet increased demand for groceries and other supplies. Evidence from jobs posted since March 23rd would support this finding, with large increases in new listings for Customer Service Representatives (over 1,700), Supervisors of Retail Sales Workers (over 1,600), and Retail Salespersons (also over 1,600).

Finally, with the increase in service sector employees working from home, it should not be surprise that IT workers are also in high demand. Application Developers (over 2,100 new listings) and employees for general Computer Occupations (with 1,800 new listings) have both seen large increases in openings since March 23rd.

EmployStats will be closely monitoring daily job postings as the coronavirus outbreak continues.

In determining if a Plaintiff made extensive efforts in their job search following their alleged wrongful termination, economic experts should look into several key factors.  Lawyer’s should be very familiar with these factors in order to best represent their client, whether Plaintiff or Defense.

  1. How many jobs has your client applied to and are they similar to the position they were terminated from?  A major point of attack experts should address in their reports will examine if the Plaintiff has performed a sufficiently diligent replacement job search. In Texas, individuals are granted unemployment benefits provided they apply for a minimum of three jobs per week.  This number can be used as the threshold for determining if a Plaintiff has done his or her due diligence in finding replacement employment after the alleged wrongful termination.
  2. How long has the Plaintiff been unemployed?  Widely accepted labor market data from the U.S. Bureau of Labor Statistics can be utilized to determine the average range an individual with a similar job position, in the same job market, would expect to be unemployed.  If the Plaintiff has been unable to find replacement employment within the typical unemployment duration, it is not likely they have performed a sufficient job search.
  3. How many job openings were available in the Plaintiff’s job market at the time of their termination?  Again, data from the U.S. Bureau of Labor Statistics can be utilized to determine job openings per month that the Plaintiff would have been qualified to hold.  In many cases, there are a significant number of job openings in the area the Plaintiff is searching.  Occasionally, a Plaintiff’s job search records will reveal that they have applied to jobs in multiple job markets, sometimes spanning across several states.  To a defense attorney requesting a mitigation analysis, this is music to their ears.  The more markets a Plaintiff makes themselves available to, the more markets experts can include when determining a number of job openings.  This only increases the number of jobs the Plaintiff could have held had they performed a sufficient job search and strengthens the argument that they have not performed such as search.

The Job Openings and Labor Turnover Survey  (JOLTS) is a monthly survey conducted by the Bureau of Labor Statistics. JOLTS collects data on total employment, the number of job openings, the number of hires, and the number of separations including quits and layoffs. JOLTS can be used to measure the growth of a particular industry and to better understand labor-market opportunities.

According to the latest release on April 5th, 2016, job hires in the United States increased to 5.4 million in February 2016, while during this same period separations made little change at 5.1 million.

For more information on the JOLTS, please refer to www.bls.gov/jlt


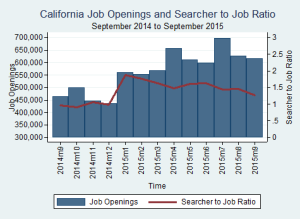
The number of job openings in California decreased from 625,696 in August 2015 to 615,711 in September 2015. The median number of job searchers per job opening across all Metropolitan Statistical Areas (MSAs) and occupations in California also decreased from 1.47 in August 2015 to 1.27 in September 2015.


CA_2015_09
Source: BLS

All 4 of the largest Metropolitan Statistical Areas (MSAs) in California experienced a decrease in job openings for the month of August.

Los Angeles – Long Beach – Santa Ana

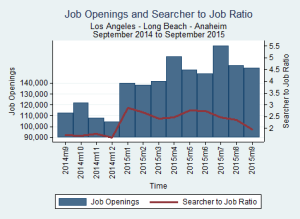
The Los Angeles-Long Beach-Santa Ana MSA experienced a decrease of 18,134 job openings in August 2015, a -10.4% change from July 2015.

Month Total Openings Percent Monthly Change
Sep-14 112,657 -17.73
Oct-14 121,598 7.94
Nov-14 108,123 -11.08
Dec-14 104,302 -3.53
Jan-15 140,013 34.24
Feb-15 137,967 -1.46
Mar-15 141,983 2.91
Apr-15 164,525 15.88
May-15 152,008 -7.61
Jun-15 148,658 -2.2
Jul-15 174,288 17.24
Aug-15 156,154 -10.4


San Francisco – Oakland – Freemont

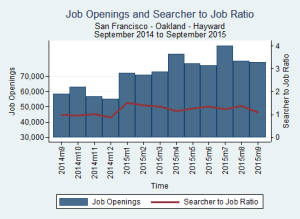
The San Francisco-Oakland-Fremont MSA experienced a decrease of 9,854 job openings in August 2015, a -10.95% change from July 2015.

Month Total Openings Percent Monthly Change
Sep-14 58,567 -15.38
Oct-14 63,065 7.68
Nov-14 56,940 -9.71
Dec-14 54,986 -3.43
Jan-15 72,089 31.11
Feb-15 70,884 -1.67
Mar-15 72,887 2.83
Apr-15 84,472 15.89
May-15 78,232 -7.39
Jun-15 77,039 -1.52
Jul-15 89,946 16.75
Aug-15 80,092 -10.95

Riverside – San Bernardino – Ontario

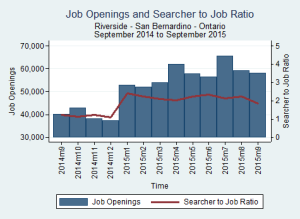
The Riverside-San Bernardino-Ontario MSA experienced a decrease of 6,442 job openings in August 2015, a -9.82% change from July 2015.

Month Total Openings Percent Monthly Change
Sep-14 40,018 -22.93
Oct-14 42,870 7.13
Nov-14 38,138 -11.04
Dec-14 37,377 -2
Jan-15 52,811 41.29
Feb-15 52,141 -1.27
Mar-15 53,849 3.27
Apr-15 62,004 15.15
May-15 57,837 -6.72
Jun-15 56,343 -2.58
Jul-15 65,608 16.44
Aug-15 59,166 -9.82

San Diego – Carlsbad – San Marcos

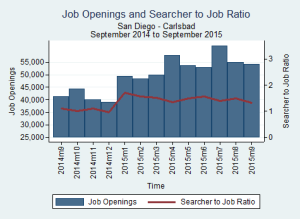
The San Diego-Carlsbad-San Marcos MSA experienced a decrease of 6,576 job openings in August 2015, a -10.7% change from July 2015.

Month Total Openings Percent Monthly Change
Sep-14 41,343 -15.64
Oct-14 44,408 7.41
Nov-14 39,956 -10.02
Dec-14 38,937 -2.55
Jan-15 49,272 26.54
Feb-15 48,492 -1.58
Mar-15 49,955 3.02
Apr-15 57,749 15.6
May-15 53,722 -6.97
Jun-15 52,803 -1.71
Jul-15 61,473 16.42
Aug-15 54,897 -10.7


Source: BLS

All four of the largest Metropolitan Statistical Areas (MSAs) in Texas experienced a decrease in job openings from July 2015 to August 2015.

Dallas

Dallas experienced a decrease of 12,075 job openings from July 2015 to August 2015, a 10.54% decrease.

Date Total Openings Monthly Change Yearly Change
Aug-15 102,497 -10.54% 43.49%
Jul-15 114,572 16.84% 27.63%
Jun-15 98,055 -1.64% 8.25%
May-15 99,685 -6.84% 17.59%
Apr-15 107,005 15.49% 26.59%
Mar-15 92,653 2.87% 3.43%
Feb-15 90,072 -1.85% 23.93%
Jan-15 91,770 38.18% 29.39%
Dec-14 66,413 -4.20% -11.31%
Nov-14 69,326 -10.74% 11.28%
Oct-14 77,670 8.74% 19.49%
Sep-14 71,430 -20.43% -6.57%

Austin

Austin experienced a decrease of 5,002 job openings from July 2015 to August 2015, a 10.34% decrease.

Date Total Openings Monthly Change Yearly Change
Aug-15 43,395 -10.34% 34.13%
Jul-15 48,397 15.94% 26.28%
Jun-15 41,742 -1.41% 7.20%
May-15 42,340 -6.27% 15.22%
Apr-15 45,170 14.25% 24.68%
Mar-15 39,536 3.03% 4.12%
Feb-15 38,372 -1.78% 23.78%
Jan-15 39,066 26.19% 28.32%
Dec-14 30,957 -1.84% -2.14%
Nov-14 31,539 -9.03% 18.96%
Oct-14 34,670 7.17% 24.53%
Sep-14 32,352 -15.59% -0.45%

Houston

Houston experienced a decrease of 10,761 job openings from July 2015 to August 2015, a decrease of 10.58%.

Date Total Openings Monthly Change Yearly Change
Aug-15 90,902 -10.58% 42.04%
Jul-15 101,663 15.95% 26.61%
Jun-15 87,680 -1.05% 7.20%
May-15 88,612 -6.05% 17.32%
Apr-15 94,317 14.01% 24.76%
Mar-15 82,726 3.76% 3.78%
Feb-15 79,730 -2.12% 20.96%
Jan-15 81,454 35.88% 28.02%
Dec-14 59,945 -3.04% -10.92%
Nov-14 61,824 -11.15% 10.35%
Oct-14 69,582 8.73% 19.68%
Sep-14 63,998 -20.30% -5.99%

San Antonio

San Antonio has experienced a decrease of 4,229 job openings from July 2015 to August 2015, a decrease of 9.5%.

Date Total Openings Monthly Change Yearly Change
Aug-15 40,261 -9.50% 39.77%
Jul-15 44,490 16.80% 22.88%
Jun-15 38,089 -2.36% 5.32%
May-15 39,009 -7.10% 14.34%
Apr-15 41,990 15.00% 23.40%
Mar-15 36,512 2.73% 1.38%
Feb-15 35,543 -1.08% 22.30%
Jan-15 35,932 34.70% 26.88%
Dec-14 26,676 -3.61% -10.95%
Nov-14 27,676 -11.80% 12.69%
Oct-14 31,377 8.93% 21.21%
Sep-14 28,805 -20.44% -4.98%


Source: BLS

California experienced an increase of 198 innovation job openings from August 2015 to September 2015, an increase of 0.72%. Texas experienced an increase of 96 innovation job openings from August 2015 to September 2015, an increase of 0.65%.

A symposium on how to grow innovation ecosystems to create wealth and jobs in the region will be paired with a MedStart event.


State Total Openings Monthly Change Yearly Change
CA 27,692 0.72% 7.85%
TX 14,906 0.65% 9.86%

Innovation jobs definition: http://www.employstats.com/blog/2014/09/26/1233/

Source: BLS

Image source: http://www.bizjournals.com/sacramento/news/2013/09/23/symposium-innovation-ecosystems-jobs-wea.html

STEM logo

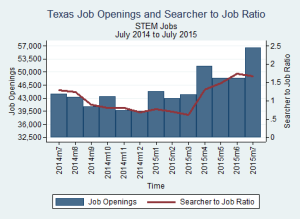
The number of job openings in Texas for STEM (science, technology, engineering, math) jobs increased from 48,441 in June to 56,433 in July 2015. The searcher-to-job opening ratio decreased from 1.73 to 1.67 in the same span.

Our definition of STEM jobs: http://www.employstats.com/blog/2014/09/19/growing-national-interest-in-stem-fields-has-focused-our-research/

STEM_2015_07

Source: BLS

Image source: http://projecttomorrowblog.blogspot.com/2013/11/i-am-scientist.html

The top three occupations with the most new job openings in Texas for the month of July were Driver/Sales Workers and Truck Drivers with 1,084 new openings, Managers with 1,061 new openings, and Cashiers with 1,145 new openings.

July 2015

Occupation Total Openings New Openings
Driver/Sales Workers and Truck Drivers 7,552 1,084
Managers 7,951 1,061
Cashiers 7,149 1,145

Source: BLS