29
SEP 2015
Posted by Dwight Steward, Ph.D. |
BLS Data,
Job openings
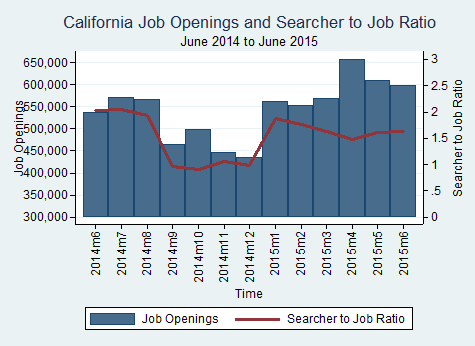
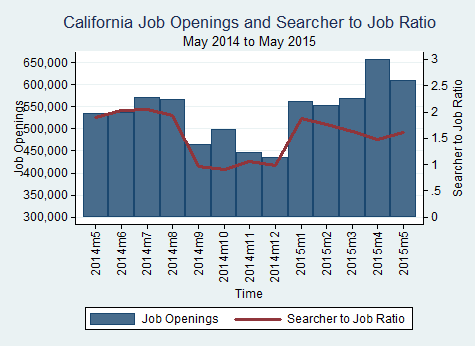
All 4 of the largest MSAs (metropolitan statistical areas) in California experienced a decrease in job openings for the month of June.
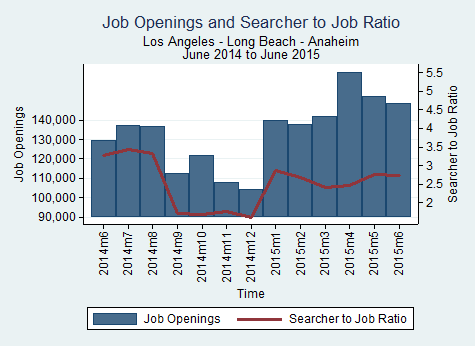
Los Angeles-Long Beach-Anaheim
The Los Angeles-Long Beach-Anaheim MSA experienced a decrease of 3,350 job openings in June 2015, a 2.20% change from May 2015.
| Month |
Total Openings |
Percent Monthly Change |
| July 2014 |
137,333 |
5.82 |
| August 2014 |
136,939 |
-0.29 |
| September 2014 |
112,657 |
-17.73 |
| October 2014 |
121,598 |
7.94 |
| November 2014 |
108,123 |
-11.08 |
| December 2014 |
104,302 |
-3.53 |
| January 2015 |
140,013 |
34.24 |
| February 2015 |
137,967 |
-1.46 |
| March 2015 |
141,983 |
2.91 |
| April 2015 |
164,525 |
15.88 |
| May 2015 |
152,008 |
-7.61 |
| June 2015 |
148,658 |
-2.20 |
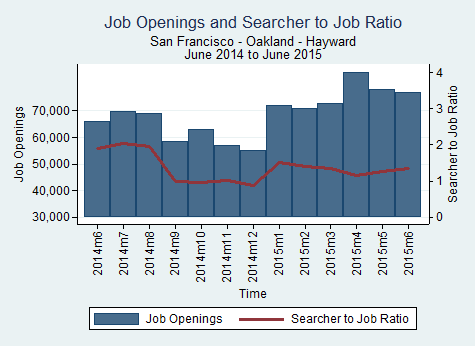
San Francisco-Oakland-Fremont
The San Francisco-Oakland-Fremont MSA experienced a decrease of 1,193 job openings in June 2015, an 1.52% change from May 2015.
| Month |
Total Openings |
Percent Monthly Change |
| July 2014 |
69,790 |
5.4 |
| August 2014 |
69,209 |
-0.83 |
| September 2014 |
58,567 |
-15.38 |
| October 2014 |
63,065 |
7.68 |
| November 2014 |
56,940 |
-9.71 |
| December 2014 |
54,986 |
-3.43 |
| January 2015 |
72,089 |
31.11 |
| February 2015 |
70,884 |
-1.67 |
| March 2015 |
72,887 |
2.83 |
| April 2015 |
84,472 |
15.89 |
| May 2015 |
78,232 |
-7.39 |
| June 2015 |
77,039 |
-1.52 |
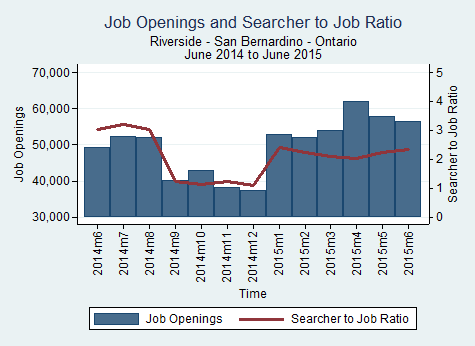
Riverside-San Bernardino-Ontario
The Riverside-San Bernardino-Ontario MSA experienced a decrease of 1,494 job openings in June 2015, an 2.58% change from May 2015.
| Month |
Total Openings |
Percent Monthly Change |
| July 2014 |
52,360 |
6.55 |
| August 2014 |
51,924 |
-0.83 |
| September 2014 |
40,018 |
-22.93 |
| October 2014 |
42,870 |
7.13 |
| November 2014 |
38,138 |
-11.04 |
| December 2014 |
37,377 |
-2.00 |
| January 2015 |
52,811 |
41.29 |
| February 2015 |
52,141 |
-1.27 |
| March 2015 |
53,849 |
3.27 |
| April 2015 |
62,004 |
15.15 |
| May 2015 |
57,837 |
-6.72 |
| June 2015 |
56,343 |
-2.58 |
San Diego-Carlsbad-San Marcos
The San Diego-Carlsbad-San Marcos MSA experienced a decrease of 919 job openings in June 2015, an 1.71% change from May 2015.
| Month |
Total Openings |
Percent Monthly Change |
| July 2014 |
49,258 |
5.52 |
| August 2014 |
49,007 |
-0.51 |
| September 2014 |
41,343 |
-15.64 |
| October 2014 |
44,408 |
7.41 |
| November 2014 |
39,956 |
-10.02 |
| December 2014 |
38,937 |
-2.55 |
| January 2015 |
49,272 |
26.54 |
| February 2015 |
48,492 |
-1.58 |
| March 2015 |
49,955 |
3.02 |
| April 2015 |
57,749 |
15.6 |
| May 2015 |
53,722 |
-6.97 |
| June 2015 |
52,803 |
-1.71 |
Source: BLS


