The Texas Workforce Commission (“TWC”) recently announced they are no longer going to utilize their TRACER 2 application to provide information regarding the Texas labor market.  For many years, the data scientists at EmployStats and other firms in Texas researched economic indicators such as employment statistics, salary and wages, and job growth using the inquiry capabilities of the TRACER 2 application.


The TWC is the state agency responsible for managing and providing workforce development services to employers and potential employees in Texas.  One of the many service the TWC provides is the access for job seekers and data scientists to reliable labor and employment statistics relevant to occupations and industries within the state of Texas.  Specifically, TWC’s TRACER 2 program provided search functions which allowed individuals to freely tabulate market trends and statistics such as employment/unemployment estimates, industry and occupational projections, and occupational wage data within Texas.


With the TWC’s TRACER 2 application “out to pasture” as the TWC puts it, data can now be accessed using a combination of other TWC databases, as well as United States Bureau of Labor Statistics (“BLS”) data such as the Local Area Unemployment Statistics (“LAUS”) and the Current Employment Statistics (“CES”).

A common allegation in wage and hour lawsuits is off-the-clock work.  In these types of cases, employees usually allege that they performed work, such as travel between job sites, that they were not paid for performing.  Other common off-the-clock-work allegations typically involve activities such as spending time in security checkpoints, putting on a uniform, preparing for work, and logging onto computer systems.


Recently, the EmployStats Wage and Hour Consulting team completed work on a case where Plaintiffs alleged unpaid off-the-clock work for time spent driving from their homes to their job sites, as well as travel time between job sites.  In this case, EmployStats was able to analyze and assess Plaintiffs’ allegations by combining and creating datasets of personnel and job location data, and using mapping programs to calculate the time Plaintiffs could have potentially spent traveling and performing off-the-clock work.


The following is an example of how the EmployStats Wage and Hour Consulting team typically handles a case involving travel time:

  1. First, the Employstats team works to combine and merge multiple databases containing employee home locations, employee time and payroll records, and job site locations into a single analyzable database.
  2. The EmployStats team then uses mapping platforms, such as Google Maps API or Mapquest API, to calculate the distance in miles and/or travel time in hours for each unique trip.
  3. Finally, the EmployStats team uses the employee time and payroll records to assess any potential damages due to travel time off-the-clock work.


Check out the EmployStats website to see how we can help you with your wage and hour cases!

The United States Census Bureau announced on September 2018 that their privacy policy regarding the 2020 Census Survey and other public use data projects will be undergoing changes, some of which could have an impact on many areas of data science.

According to a December 2018 report  written by the Institute for Social Research and Data Innovation (ISRDI), University of Minnesota, the US Census Bureau’s new set of standards and methods for disclosure, known as differential privacy, may make it impossible to access usable microdata and severely limit access to other important public use data.

Data scientists, including those at EmployStats, have been regularly utilizing free reliable public Census Bureau data to analyze social and economic factors across America for over six decades.  The US Census Bureau releases public microdata such as the Decennial Census and the American Community Survey, which collects information on demographics, employment, income, household characteristics, and other social and economic factors.  EmployStats uses this data regularly to assist clients in Labor and Employment cases.

The ISRDI report can be found here.

To find out more about how EmployStats can assist you with your Labor and Employment case, please visit www.EmployStats.com and make sure to follow us on Twitter @employstatsnews

The EmployStats team is thrilled to announce a new division of expertise that we can now provide to our clients.


Starting in January 2019, the new Wage and Hour Data consulting division began operation under the leadership of Consultant Matt Rigling.  Matt Rigling obtained his Master’s of Arts in Economics from the University of Texas at Austin, and has been providing EmployStats’ clients with database and data analytics consulting for the past three years.  Under this new division of EmployStats, the team will strive to provide our wage and hour clients with the expertise they need in the construction and tabulation of time and pay record databases, as well as providing wage and hour penalty calculations for our clients in states such as California and New York.  


This type of consultation is perfect for both plaintiff and defense attorneys seeking to have the best support for their client in order to efficiently reach a settlement at mediation, as well as both private and government entities simply seeking to perform internal audits of their labor practices.  EmployStats has the capability to swiftly handle large and cumbersome data sets that can sometimes bog down attorneys and paralegals attempting to handle the analysis in-house.


Follow this blog as we continue to post about tips for efficiently using data to bring your wage and hour cases to settlement, updates on upcoming events, and current events in the world of labor and employment law.  For more information on Matt Rigling and the EmployStats team, please check us out on our website and social media accounts!

EmployStats Website

LinkedIn

Twitter

In determining if a Plaintiff made extensive efforts in their job search following their alleged wrongful termination, economic experts should look into several key factors.  Lawyer’s should be very familiar with these factors in order to best represent their client, whether Plaintiff or Defense.

  1. How many jobs has your client applied to and are they similar to the position they were terminated from?  A major point of attack experts should address in their reports will examine if the Plaintiff has performed a sufficiently diligent replacement job search. In Texas, individuals are granted unemployment benefits provided they apply for a minimum of three jobs per week.  This number can be used as the threshold for determining if a Plaintiff has done his or her due diligence in finding replacement employment after the alleged wrongful termination.
  2. How long has the Plaintiff been unemployed?  Widely accepted labor market data from the U.S. Bureau of Labor Statistics can be utilized to determine the average range an individual with a similar job position, in the same job market, would expect to be unemployed.  If the Plaintiff has been unable to find replacement employment within the typical unemployment duration, it is not likely they have performed a sufficient job search.
  3. How many job openings were available in the Plaintiff’s job market at the time of their termination?  Again, data from the U.S. Bureau of Labor Statistics can be utilized to determine job openings per month that the Plaintiff would have been qualified to hold.  In many cases, there are a significant number of job openings in the area the Plaintiff is searching.  Occasionally, a Plaintiff’s job search records will reveal that they have applied to jobs in multiple job markets, sometimes spanning across several states.  To a defense attorney requesting a mitigation analysis, this is music to their ears.  The more markets a Plaintiff makes themselves available to, the more markets experts can include when determining a number of job openings.  This only increases the number of jobs the Plaintiff could have held had they performed a sufficient job search and strengthens the argument that they have not performed such as search.

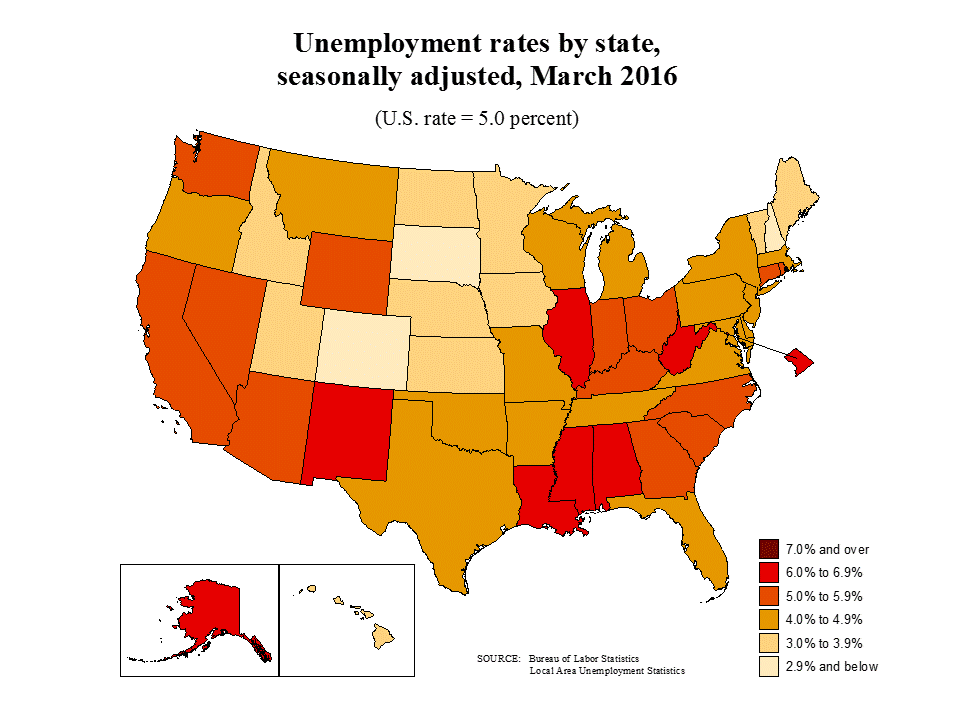
Local Area Unemployment Statistics (LAUS) is made available by the Bureau of Labor Statistics (BLS), and offers monthly data on employment and unemployment for approximately 7,500 geographic areas. Unemployment rates are available monthly by county, MSA, and state level.

These estimates are key indicators of local economic conditions, and may be compared over time to examine changes in the labor market.

For more information regarding the LAUS, please refer to www.bls.gov/lau

The Job Openings and Labor Turnover Survey  (JOLTS) is a monthly survey conducted by the Bureau of Labor Statistics. JOLTS collects data on total employment, the number of job openings, the number of hires, and the number of separations including quits and layoffs. JOLTS can be used to measure the growth of a particular industry and to better understand labor-market opportunities.

According to the latest release on April 5th, 2016, job hires in the United States increased to 5.4 million in February 2016, while during this same period separations made little change at 5.1 million.

For more information on the JOLTS, please refer to www.bls.gov/jlt


The Equal Employment Opportunity (EEO) Census is a tabulation created every ten years for the purpose of serving as an external benchmark for comparing the composition of a company’s workforce to that of the external labor market within a specific geographic area and job category. The EEO Census provides worker counts based on race, ethnicity, gender, age, education level, industry, occupation, and geography. While the raw data is not readily available, 24 tables provide counts for varying cuts of the data.

The EEO Census is most often seen in Affirmative Action Plans and EEO Commission compliance reviews. It is also useful in the litigation setting companies when there are allegations of discrimination.

For more information, please refer to: www.census.gov/hhes/www/eeoindex/eeoindex.html

The American Statistical Association released an important statement and supporting paper concerning the use and interpretation of statistical significance and p-values in statistical research.

pvalues

The American Statistical Associations’ statement notes that the increased quantification of scientific research and a proliferation of large, complex data sets, often referred to as Big Data, has expanded the scope for statistics.  Accordingly, the importance of appropriately chosen techniques, properly conducted analyses, and correct interpretation has also increased.

This statement by the ASA furthers, and in some ways solidifies, the ground roots “counter-statistical significance” movement that many economists and statisticians, such as Steve Zillack and Diedre McCloskey, have been working on for decades.

Real-World-Matters-Statistically-Significant-1024x509

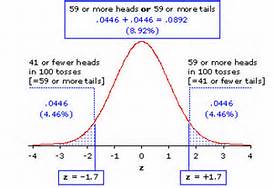
According to the ASA statement “The p-value [and the concept of statistical significance] was never intended to be a substitute for scientific reasoning,” said Ron Wasserstein, the ASA’s executive director. In research analysts use the data to calculate a p-value which shows how consistent the data is with the research hypothesis.  A small p-value is typically interpreted as having a small likelihood of being consistent with the research hypothesis.   In research papers, small p-values are in essence viewed as a ‘good thing’ and according to the ASA statement, are more favored by journal editors for publication.

The ASA statement argues against this approach.  Instead, the ASA statement states that “Well-reasoned statistical arguments contain much more than the value of a single number and whether that number exceeds an arbitrary threshold.”

See:

Ronald L. Wasserstein & Nicole A. Lazar (2016): The ASA’s statement on p-values: context, process, and purpose, The American Statistician, DOI: 10.1080/00031305.2016.1154108

Ziliak, S.T., and McCloskey, D.N. (2008), The Cult of Statistical Significance: How the Standard Error Costs Us Jobs, Justice, and Lives, Ann Arbor: University of Michigan Press

Ziliak, S.T. (2010), “The Validus Medicus and a New Gold Standard,” The Lancet, 376, 9738, 324-325.


The National Longitudinal Survey of Youth (NLSY) is a Bureau of Labor Statistics longitudinal study that repeatedly surveys approximately 12,000 individuals every two years.  These individuals, who were selected at the beginning of the survey, are followed over time and surveyed on issues such as the individual’s educational and employment experiences.

Ordered probit regressions and the NLSY can be used to estimate the probability of different levels of educational attainment.  The probability of an individual obtaining a high school or college degree can be calculated based on demographic characteristics, such as race and gender, and household characteristics, such as family structure or parental educational attainment levels.

Regression analysis on NLSY data has also been used to estimate the length of time it takes for an individual’s salary to catch up after an employment termination.  This data can be used to determine the appropriate length of damages in wrongful termination cases.

For more information, see http://www.bls.gov/nls.