27
JUL 2015
All 4 of the largest MSAs (metropolitan statistical areas) in California experienced a decrease in job openings for the month of May.
Los Angeles-Long Beach-Anaheim
The Los Angeles-Long Beach-Anaheim MSA experienced a decrease of 12,517 job openings in May 2015, a 7.61% change from April 2015.
| Month |
Total Openings |
Percent Monthly Change |
| Jun-14 |
129,782 |
0.19 |
| Jul-14 |
137,333 |
5.82 |
| Aug-14 |
136,939 |
-0.29 |
| Sep-14 |
112,657 |
-17.73 |
| Oct-14 |
121,598 |
7.94 |
| Nov-14 |
108,123 |
-11.08 |
| Dec-14 |
104,302 |
-3.53 |
| Jan-15 |
140,013 |
34.24 |
| Feb-15 |
137,967 |
-1.46 |
| Mar-15 |
141,983 |
2.91 |
| Apr-15 |
164,525 |
15.88 |
| May-15 |
152,008 |
-7.61 |
San Francisco-Oakland-Fremont
The San Francisco-Oakland-Fremont MSA experienced a decrease of 6,240 job openings in May 2015, an 7.39% change from April 2015.
| Month |
Total Openings |
Percent Monthly Change |
| Jun-14 |
66,213 |
0.65 |
| Jul-14 |
69,790 |
5.4 |
| Aug-14 |
69,209 |
-0.83 |
| Sep-14 |
58,567 |
-15.38 |
| Oct-14 |
63,065 |
7.68 |
| Nov-14 |
56,940 |
-9.71 |
| Dec-14 |
54,986 |
-3.43 |
| Jan-15 |
72,089 |
31.11 |
| Feb-15 |
70,884 |
-1.67 |
| Mar-15 |
72,887 |
2.83 |
| Apr-15 |
84,472 |
15.89 |
| May-15 |
78,232 |
-7.39 |
Riverside-San Bernardino-Ontario
The Riverside-San Bernardino-Ontario MSA experienced a decrease of 4,167 job openings in May 2015, an 6.72% change from April 2015.
| Month |
Total Openings |
Percent Monthly Change |
| Jun-14 |
49,141 |
0.42 |
| Jul-14 |
52,360 |
6.55 |
| Aug-14 |
51,924 |
-0.83 |
| Sep-14 |
40,018 |
-22.93 |
| Oct-14 |
42,870 |
7.13 |
| Nov-14 |
38,138 |
-11.04 |
| Dec-14 |
37,377 |
-2.00 |
| Jan-15 |
52,811 |
41.29 |
| Feb-15 |
52,141 |
-1.27 |
| Mar-15 |
53,849 |
3.27 |
| Apr-15 |
62,004 |
15.15 |
| May-15 |
57,837 |
-6.72 |
San Diego-Carlsbad-San Marcos
The San Diego-Carlsbad-San Marcos MSA experienced a decrease of 4,027 job openings in May 2015, an 6.97% change from April 2015.
| Month |
Total Openings |
Percent Monthly Change |
| Jun-14 |
46,681 |
0.71 |
| Jul-14 |
49,258 |
5.52 |
| Aug-14 |
49,007 |
-0.51 |
| Sep-14 |
41,343 |
-15.64 |
| Oct-14 |
44,408 |
7.41 |
| Nov-14 |
39,956 |
-10.02 |
| Dec-14 |
38,937 |
-2.55 |
| Jan-15 |
49,272 |
26.54 |
| Feb-15 |
48,492 |
-1.58 |
| Mar-15 |
49,955 |
3.02 |
| Apr-15 |
57,749 |
15.6 |
| May-15 |
53,722 |
-6.97 |
Source: BLS

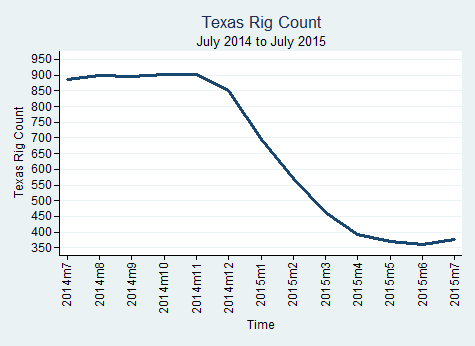


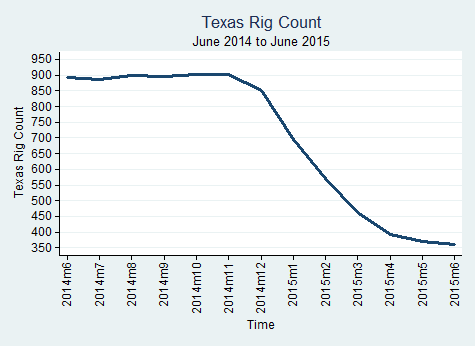
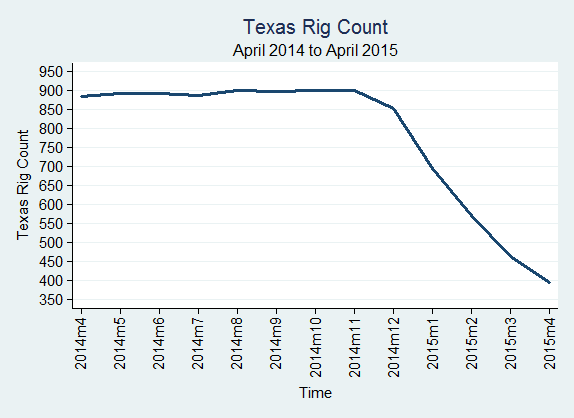
 The number of job openings in Texas for “petroleum engineers” and “geological and petroleum technicians” decreased from 661 in April 2015 to 639 in May 2015, while the searcher-to-job opening ratio increased from 1.97 to 2.16 in the same span.


