Time clock rounding analysis in wage and hour/FLSA case example


(Work in progress…)

An example of a time clock rounding analysis in a wage and hour case.  In this case, we describe a case example involving a large mid western employer.  The data utilized in this analysis is the time data received for the February 28, 2003 to December 18, 2011 time period.  The data contained 66,452 records.

In this wage and hour time rounding case the defendant and plaintiff disagree on a number of key data issues.  One party states, that in his analysis “all 66,452 shifts described in the data set were considered.”  The other party states that this statement is completely incorrect use of the data in this case.  First and foremost, they argue that there are 13,877 records which do not have any rounded time entries or punch time entries.  It appears as though one party utilized these records in his calculations of percentage

In those records where there are no time entries, the record would appear to have neutral rounding (that is, blank compared to blank).  Including these records in the data artificially increases the number of neutral rounding.  One party argues that this is especially problematic because the opposing expert includes the neutral rounding in with the rounding in one party’s favor, which distorts the results.

Second, parties argue that there are an additional 7,089 records with inappropriate pay code names that should not be included in the meal or rounding analyses. These codes have duplicate entries of the time data, no hours paid, or have $0 associated with them in the pay data.

Third, further analysis showed that there are an additional 8,245 records that have duplicate entries for the start time, end time, and punch times from other records on the same days. These records also contain paid hours that would need to be included in determining the total number of hours paid in a particular day.  For these records, the number of hours paid should be included in the total number of hours paid for that day.  However, the parties argue the rounded time and actual time worked should not include the duplicated time records for these days.

After the three cuts described above, one side argues that the remaining 35,000 or so records are the appropriate starting point for the analysis. The parties argue that utilizing the data cuts results in drastically different results in the time clock rounding analysis.

  1.  Definitions:
    1. Total rounded time is calculated from the start and end times in the data. Total actual time is calculated from the punch in and out times in the data.  The amount of time that was rounded is calculated by comparing the rounded time to the actual time worked.
    2. The percent of punch sets with time gained is the number of instances where the punch set showed a rounding in the employees’ favor, divided by the total number of punch sets. Whereas the percent of punch sets with time lost is the number of instances where the punch set showed a rounding in the employers’ favor, divided by the total number of punch sets.
    1. Time gained due to rounding is the total amount of time rounded in instances where the punch set showed a rounding in the employees’ favor. Time lost due to rounding is the total amount of time rounded in instances where the punch set showed a rounding in the employers’ favor.  Net time gained / lost due to rounding is the sum of time gained and time lost.

Analyzing time clock rounding allegations in a wage and hour or FLSA case: The Data Two-Step

At its core, the analysis of time clock rounding allegations in a wage and hour or FLSA case is straight forward  That is, the analysis typically involves determining if the time clocking rounding was neutral or did it favor the employee or employer, more times than not?

In practice, the analysis can be surprisingly somewhat complicated.  The complications generally arise with reading and converting data to a usable format and interpreting the time punch entries.  Both of these steps can have an impact on the underlying time clock rounding calculation  A two step data process is common in a lot of wage and hour and FLSA time rounding cases.

Generally, getting the time punch data into an electronic format is preferable to data entry.  However, the data provided by many time keeping systems, such as Kronos or others, are not directly compatible with popular spreadsheet and data base programs like Excel and Access.  In many (if not most) instances, the data will need to be converted before it can be used  for an analysis in a wage and hour or FLSA case analysis.

Step 1: Converting the data

First, the time punch is converted using either OCR or text conversion programs to a raw text format.  The raw format of the time data is typically very messy.  However, as long as the conversion is accurate and the data is laid out in the same format, the messiness of the data is typically not a big problem.

Step 2: Producing a usable data set

Second, computer routines written in data analysis programs, such as STATA, are used to convert the data into an analyzable format.  A usable data format  for data in a wage and hour or FLSA time rounding case  is one where the data is laid out into. columns and rows of data.


Calculating FLSA overtime (OT) and total compensation owed

Calculating OT correctly for non-exempt employees can be complicated.  The complication often revolves around the fact that there is one definition of a overtime rate but there are multiple ways to calculate the total overtime and straight time compensation owed to an employee.  If the underlying components of the OT computation are correctly calculated then the different methodologies should yield equivalent total compensation amounts .

Background

Under FLSA, non-exempt employees are paid OT at a rate of one and half times the regular rate.  The regular rate of pay is based on the individuals total compensation, which includes the employee’s base rate of pay and certain bonuses and  total hours worked in the work week.  Generally, under FLSA OT is paid on all hours above 40 in a work week.

The FLSA does not explicitly define a work week(http://biznik.com/articles/department-of-labor-approves-9-day-work-schedule-w-o-overtime.)  For some employees a work week is typically defined as a 7-day Sunday to Saturday time period.  For some job positions, like fire fighters and employees on alternative week schedules the employers overtime rate calculation is based on a different work week schedule.   The 9-80 work week is an example of a compressed work week schedule. ( http://www.wage-hour.net/post/2012/05/26/What-Is-A-980-Pay-Plan.aspx)  Under the compressed work week the employee works 9 days in a two week period but not more than 40 hours in either workweek. According to Fisher Phillips:

Under a typical 9/80 arrangement, the non-exempt employee works four 9-hour days, followed by an 8-hour workday day that is split into 4-hour portions by the mid-day ending of the first workweek, and then works four more 9-hour days in the second workweek.  The key is that the employee’s workweek ends during the 8-hour workday, causing the first four hours worked that day to fall into one workweek and the remaining four hours worked that day to fall into the next workweek.  In this way, the employee’s hours worked in each workweek do not exceed 40.

There are certain conditions that the employer must meet to be able to switch to a compressed work week.

Law enforcement and fire protection employees also typically have a different work week.  (http://www.dol.gov/whd/regs/compliance/whdfs8.pdf).  For these employees,

A “work period” may be from 7 consecutive days to 28 consecutive days in
length. For work periods of at least 7 but less than 28 days, overtime pay is required when the number of hours worked exceeds the number of hours that bears the same relationship to 212 (fire) or 171 (police) as the number of days in the work period bears to 28.

In certain states, like California, individuals are paid OT on the hours above 8 worked in a day.  In California, individuals are generally paid double time or 2 times their regular rate of pay, on hours worked in excess of 12 in a day. There is no provision for double time under the FLSA.

In California, employers may adopt what are known as Alternative Work Week Schedules that define a workweek differently from the standard 7 day time period or 5 day, 40 hour week from Monday to Friday.  Before adopting an alternative work week schedule the employer must meet certain criteria and the alternative work week must be approved by the employees in an election.  Alternative work week schedules include 4/40, 8/80 and 9/80.  (http://www.calhr.ca.gov/employees/pages/alternate-work-week-policy.aspx)

This site provides a database of the Alternative Work Week adoptions for the State of California. http://www.dir.ca.gov/databases/oprl/DLSR-AWE.html.  See also http://www.calpeculiarities.com/2013/05/29/tired-of-the-9-5-grind-consider-an-alternative-workweek-schedule/


STEM jobs decreased in TX for the month of August

Texas experienced an increase of 8,724 innovation job openings from August 2014 to August 2014, an annual increase of 25.30%.

Our definition of STEM jobs: http://www.employstats.com/blog/2014/09/19/growing-national-interest-in-stem-fields-has-focused-our-research/

STEM logo


Month Total_Openings Percent_Monthly_Change Percent_Yearly_Change
08/2014 43,210 -2.03% 25.30%

Source: BLS

Image source: http://projecttomorrowblog.blogspot.com/2013/11/i-am-scientist.html

Crude oil prices and natural gas prices decreased from September to October

prices_2014_10
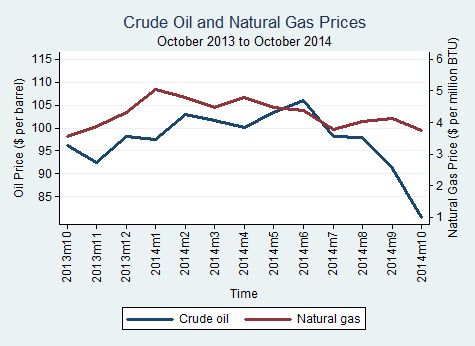
Crude oil price decreased from $91.17 per barrel in September 2014 to $80.53 per barrel in October 2014. Natural gas price went down from $4.14 per million BTU (one million BTU is approximately 974 cubic feet) in September 2014 to $3.76 per million BTU in October 2014.

production_2014_08

Texas crude oil production for August 2014 was 69,204,407 barrels, down from 73,329,467 barrels reported in July 2014. Texas natural gas production was 621,505,586 Mcf (thousand cubic feet) of gas in August 2014, down from the July 2014 gas production total of 662,617,068 Mcf.

Sources: eia.gov, rrc.state.tx.us