Calculating Damages and Customizing Labor Market Data

In employment and economic damage cases, knowing the plaintiff’s re-employment opportunities and job search efforts is crucial in calculating damages. 

Each plaintiff’s knowledge and responsibilities are used to analyze labor market conditions and supplies. What makes EmployStats unique is our ability to customize and personalize labor market data to best match our plaintiff’s expertise level. We utilize a number of data sources including electronic job search data and public labor data sources such as the U.S. Bureau of labor statistics (BLS) for analyzing labor mitigation cases.

Obtaining this information based on labor market conditions and labor market supply allows us to customize our data based on each plaintiff’s characteristics making the labor mitigation analysis unique.


For more information contact us at 1-866-629-0011 or info@employstats.com.

Gathering Data for Labor Market and Mitigation Studies

Performing labor market and mitigation studies requires gathering and using specific information. Often, this information pertains to the plaintiff’s job search efforts within the labor market. For example, did the individual apply for jobs that matched their expertise and education level. Additionally, if an application is made to a different job, we must determine if the job qualifications are similar to their previous position.

Labor market data sources such as, U.S. Bureau of Labor Statistics labor market survey (BLS) and U.S Department of Labor’s ONET, are often used to analyze an individual’s potential job matches.  It is through this type of research that an accurate picture of the plaintiff’s job search efforts can be measured and provide needed information in these types of labor market and mitigation studies.

For more information visit Employstats or contact us at info@employstats.com.

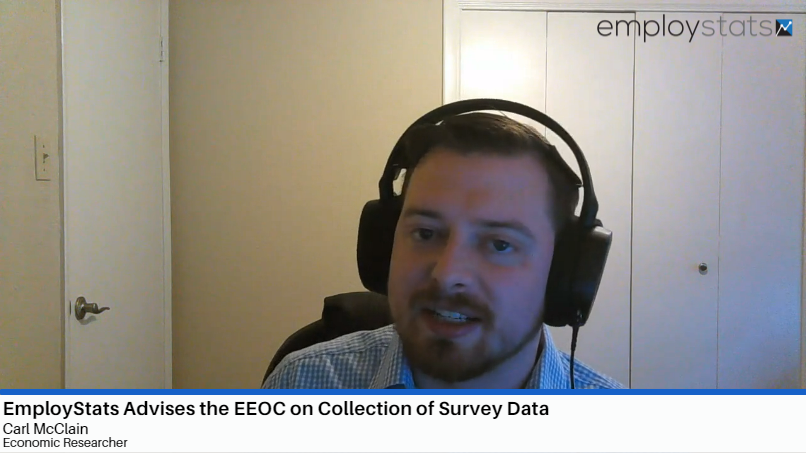
EmployStats Advises the EEOC on Collection of Survey Data

EmployStats was brought on to provide our feedback on the best uses of this EEOC-2 data. In these panel meetings, we testified about our industry level experience in using available pay data to analyze claims of disparate pay and employment discrimination. We described to the EEOC how companies like EmployStats, research institutions, and public users utilize federally maintained datasets in practice, comparing the survey data the EEOC collected to other federal databases like the Bureau of Labor Statistics (BLS).

We explained the benefits of current benchmark pay data from different public and private sources, and what additional value the EEO-2 survey data could bring. We also provided EEOC recommendations on best practices for the formatting and publication of the EEOC’s data, so this survey data can be of maximum utility to researchers and the general public. 

A few years ago the EEOC had created an additional component to their Equal Employment Opportunity (EEO) survey sent out to employers in the United States, known as Component 2 (EEOC-2 / EEO-2). This addition to their survey asked employers about the compensation of employees and their hours worked, organized by job category, gender, race, ethnicity, and certain pay bands. After collecting this data, the EEOC was interested in analyzing this data and determining how it could be best utilized by both the commission, and the public at large. Partnering with the National Academy of Sciences (NAS), the EEOC formed a panel to closely examine this compensation data, and collect input on its utilization. EmployStats was able to collaborate with several well known professionals including William Rogers, Elizabeth Hirsh, Jenifer Park, and Claudia Goldin

To discuss a potential case or to answer any questions, you can email info@employstats.com or contact us at 1-866-629-0011.

Making Wage and Hour Data Analysis Cost Effective

Making Wage and Hour Data Analysis Cost Effective

Calculating unpaid wages, penalties, and other potential wage and hour violations can be a costly endeavor. In some cases, many hours could be spent just getting the payroll and time data into a format that could be analyzed. There are a few things that can help lower time and cost of performing a wage and hour data analysis.


  • Understand the Time and Payroll Data Before You Start

Getting the employer to provide the background information for the underlying time and payroll data will help save time and money in the future.  

Knowing what the different payroll codes mean, how the time and payroll records fit together, the employer’s pay period end and start dates, and the types of bonuses that the employees earned can help streamline the data management and analysis process.


  • Computer Program Every Step of the Analysis

Use computer programs such as R, STATA, VBA or something similar to handle the data management and analysis. Writing computer code in these types of programs will make managing the time and payroll data and making adjustments to the analysis both easier and replicable.  


  • Establish Clear Objectives

Before you get started, be clear which types of wage and hour violations you need to study. This is particularly important when dealing with time punch data. A lot of time and energy can be saved on the front end by structuring the time and payroll data into a format that will make determining things, such as the hours worked, easier on the backend.


  • Context of Wage and Hour Analysis

After you establish the types of wage and hour violations, determine the type of violations–local, state or federal. Each type of violation may require different types of analysis.

The 80/20 Rule: Defining Tip Credit

In the most recent Fisher Phillips Wage and Hour Wednesdays, the Department of Labor (DOL) 80/20 tip ruling allowing employers to take a tip credit for “tip-producing work” was reviewed. Hosted by Fisher Phillips Ted Boehm and Susan Maupin Boone.

The Fair Labor Standards Act (FLSA) allows employers to pay certain employees a direct cash wage below the $7.25/hr federal minimum wage. Employers are allowed to take a tip credit of up to $5.12/hr to make up the difference. However, if the employee’s total wage plus tips does not equal the minimum wage, the employer must pay the difference. If tipped employees spend more than 20% of their working hours in a week performing “directly supporting work”, the tip credit is lost for the excess time and full minimum wage must be paid for that portion of work. 

EmployStats Economic Consultant, Matt Rigling, has discovered in his work that differentiating tip-producing work and directly supporting work is important to applying the 80/20 rule. Tip-producing work can be defined as performing tasks such as taking orders, serving, and fulfilling customer needs during meal service and operating hours. Directly supporting work is identified as pre and post service work such as prepping, cleaning, and stocking inventory. 

For more information visit Fisher Phillips.

What is the Latest on the Minimum Wage?

A paper published in the NBER in January of 2021 attempts to cast new light on minimum wage research in the United States. The working paper, co-authored by Professor David Neumark and Peter Shirley is titled “Myth or Measurement: What Does the New Minimum Wage Research Say About Minimum Wages and Job Loss in the United States?”. The paper argues that, contrary to more traditional summaries of the literature, there is a clear evidence of the negative impacts of minimum wages on employment.

Concentrating on research evidence from within the United States since the early 1990s, Neumark and Shirley assembled all the available papers and literature published in the 30 years on the topic. Neumark and Shirley identified the core estimates and the key takeaways from the authors and researchers on each study. After assembling all of the literature, they find that almost 80% of studies in the literature suggest negative employment effects from raising the minimum wage.

There were several other takeaways from Neumark’s research. For instance, the evidence that the minimum wage had strong, negative employment effects was far more robust for certain populations, such as teens, young adults, and the less educated. At the same time, while studies of low wage industries broadly show negative employment effects, the research is not as decisively one sided.

The evidence is not unambiguous, with some research in specific categories (such low-skilled workers) showing net zero or even positive effects from raising the minimum wage. But, as the paper shows clearly that most of the evidence indicates that “minimum wages reduce low-skilled employment.” And that “It is incumbent on anyone arguing that research supports the
opposite conclusion to explain why most of the studies are wrong.”

See here for Neumark & Shirley working paper.

When Does Age Discrimination Begin?

An article published by Forbes in January 2020, discusses age discrimination in the workplace, specifically during the hiring process. The article written by Patricia Barnes highlights the working paper by Professor David Neumark titled “Age Discrimination in Hiring: Evidence from Age-Bling vs. Non-Age-Blind Hiring Procedures”.  Both the article and paper indicate that discrimination begins to occur at the time age becomes apparent to the employer. This can be at different times and are often specific to each employer’s practices and hiring procedures. 

One of the key findings of Neumark’s research is that individuals that apply for a job position in-person are substantially less likely to continue on in the hiring process than those individuals that apply for a job position on the Internet. While other indicators of age, such as dates of education and employment, may lead to discrimination through Internet applications, they are less obvious and less accurate indicators of age.  

In Neumark’s study and working paper, an individual turning in an application for a restaurant in-person was about 50% more likely to not receive a job offer than someone who did not apply in person, but received an interview. Potential discrimination existed throughout the hiring process depending on the time the employer was made aware of an applicant’s age. 

When calculating damages in discrimination lawsuits specifically claiming failure to hire, it is important to understand the timeline and when during hiring potential discrimination might have taken place.  It is likely necessary to investigate multiple steps in the hiring process to reveal or refute discriminatory hiring practices, as outlined by Neumark’s paper. 

See here for Professor Neumark’s full working paper.

Texas Job Market Sees Increased Demand for Medical, Supply Chain Workers Amid Coronavirus

The 2020 coronavirus outbreak has sparked severe shocks to the United States labor market. Social distancing policies, designed to slow the spread of the disease, are leading to large layoffs in specific industries, like bars and restaurants. Many more employees in other sectors face the prospect of unemployment or temporary furloughs. Despite this economic strain, employers, particularly those in Medical and Supply Chain services, are expanding to meet new demand. These sectors continue to post job opportunities long after policymakers mandated the closure of non-essential services or issued “shelter-in-place” orders.

Evidence from Texas over the past half-month reveals both predictable and unexpected trends in new job opportunities. It may come as a surprise that, even in this “lockdown economy,” there is still help wanted.

Beginning on March 18th, Texas began implementing statewide social distancing policies, though some areas began issuing such orders days earlier. Cities and counties across the state gradually adopted “shelter-in-place” orders in March.  By March 31st, a statewide order asked residents to stay home, except if they participated in “essential services and activities.”

But within the past two weeks, Texas employers posted over 66,000 new job openings.

Daily job postings are one indicator of up-to-date labor market demand, available from a variety of sources (most notably online).  The Texas Workforce Commission (“TWC”) is the state agency responsible for managing and providing workforce development services to employers and potential employees in Texas.  One service the TWC provides is access to databases of up-to-date job postings for different occupations and employers within the state. These job postings can come from the TWC itself, or from third party sites like Monster or Indeed. This information is extraordinarily valuable to data scientists.

The top 10 in demand occupations cover a variety of occupations, but are heavily concentrated in the healthcare, supply chain, and IT sectors.

Given the stresses to the healthcare system, its little surprise that hospitals are looking for more front-line staff. Registered Nurses were the highest in demand occupation, with over 3,000 new job listings since March 23rd.


Retail supply chains are also expanding employment.  Sales Representatives for Wholesalers and Manufacturers, with over 2,300 new listings, was the second highest in demand occupation. Other logistical occupations saw large numbers of new openings, particularly for Truck Drivers, with over 1,200 new job postings since March 23rd.

Anecdotally, supermarkets and retail chains have been hiring more employees to meet increased demand for groceries and other supplies. Evidence from jobs posted since March 23rd would support this finding, with large increases in new listings for Customer Service Representatives (over 1,700), Supervisors of Retail Sales Workers (over 1,600), and Retail Salespersons (also over 1,600).

Finally, with the increase in service sector employees working from home, it should not be surprise that IT workers are also in high demand. Application Developers (over 2,100 new listings) and employees for general Computer Occupations (with 1,800 new listings) have both seen large increases in openings since March 23rd.

EmployStats will be closely monitoring daily job postings as the coronavirus outbreak continues.

Economics and Statistics Experts in Wage and Hour Litigation

Complex wage and hour litigation often involves significant data management and sophisticated analyses in order to assess potential liability and damages. This article highlights common wage and hour data management issues, sampling and surveying, as well as provides a case study as an example of the use of sampling in an overtime misclassification case.

Download Dr. Dwight Steward and Matt Rigling’s paper on wage and hour expert economists here!

Economics and Statistics Experts in Wage and Hour Litigation

Sampling in Wage and Hour Cases

Often in wage and hour cases, attorneys are faced with the decision of analyzing the complete time and payroll records for a class population, or analyzing just a sample of the population’s records.  While in an ideal world, analyzing the full population of data is the best approach, it may not always be feasible to do so.

For instance, some of the individuals within the class may be missing records due to poor data management, or perhaps both sides agree that the analysis of the full population may be too costly or time consuming.  In these cases, the attorneys can elect to have an expert randomly select a random sample from the full population to perform a reliable and statistically significant random sample.

Below are some common terms related that attorney’s can expect to hear when discussing sampling in their wage and hour cases:

Random Sampling, n. sampling in which every individual has a known probability of being selected.

Sample, n. a set of individuals or items drawn from a parent population.

Sample Size, n. the number of individuals or items in a sample.

Simple Random Sampling, n. sampling in which every individual has an equal probability of being selected and each selection is independent of the others.

Discussion: This very common statistical routine is analogous to ‘pulling a name out of a hat’.

Stratified Sampling, n. a method of statistical sampling that draws sub-samples from different sections, or strata, of the overall data population.

Discussion: Stratified sampling routines are used in employment settings when there are important differences between different groups of employees being surveyed. For example, in a survey of off-the-clock work, workers at different locations, and with different supervisors, may have different work cultures that make them more (or less) likely than other workers to have worked during their lunch period. In this instance, a stratified sampling routine may be used to account for those differences.