Some economists and research suggest inflation may be good for the economy

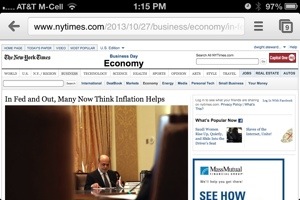
Some economists and recent research support the idea of allowing inflation to increase above its current target of 2%. Proponents argue that increases prices will stimulate growth and increase business profits. Opponents argue that inflation could grow out of control and hurt fixed income investments.

http://www.nytimes.com/2013/10/27/business/economy/in-fed-and-out-many-now-think-inflation-helps.html?hp

20131027-132545.jpg

Harley Davidson’s are niche market ; albeit a big niche.

Harley-Davidson  Co. said it expects to ship 259,000 to 264,000 motorcycles to dealers and distributors worldwide in 2013….In the U.S., dealers sold 48,529 new motorcycles in the quarter, up 20.1 percent compared to sales of 40,402 motorcycles in the year-ago period.

Revenue from motorcycles grew 10.7 percent to $857 million, compared to revenue of $774 million in the year-ago period….


More…

Discussions on low interest rates and the zero bound

From the University of Texas at Austin Economics Department:

Dr. Coibion on low interests: “One of the defining features of the current economic crisis has been the zero bound on nominal interest rates….

From the St. Louis fed:

Working Paper #2013-007C;  ” Global Dynamics at the Zero Lower Bound“,    by William T. Gavin, Benjamin D. Keen, Alexander Richter and Nathaniel Throckmorton

Abstract: …We also evaluate how monetary policy affects the likelihood of hitting the ZLB. A policy rule based on a dual mandate is more likely to cause ZLB events when the central bank places greater emphasis on output stabilization.

The cost of fiscal uncertainty on the U.S. economy

New study quantifies the cost of fiscal uncertainty. They find:

Fiscal Policy Uncertainty: Since late 2009, fiscal policy uncertainty has raised the Baa corporate bond spread by 38 basis points, lowered GDP growth by 0.3 percentage points per year, and raised the unemployment rate in 2013 by 0.6 percentage points, equivalent to 900,000 lost jobs.

Read the full report

Estimates of $40,000,000 loss in cattle in S.D. blizzard

state officials estimate a death toll of as many as 20,000 cows. An official number may not be known for weeks as producers continue to search for livestock. But the loss has become about more than the economic devastation, which could linger for years and put some producers out of business. South Dakotans are fiercely self-reliant, but they now feel invisible as they ask federal officials to lend a hand.

http://www.nytimes.com/2013/10/16/us/as-south-dakota-ranchers-face-storms-toll-us-helping-hands-are-tied.html?hp=&adxnnl=1&adxnnlx=1381932922-6WTOQQi4qDmSUMLNVp2P7A

Life care expenses and the Affordable Care Act

Joshua Congdon-Hohman and Victor Matheson,”Potential Effects of the Affordable Care Act on the Award of Life Care Expenses”  JFE 24(2) 2013,  argue that the ACA will change the role and tasks of life care planner in injury cases.   The authors argue that many of the typical expenses that occur in an injury case will be capped at $6,250 per year.  They believe that the role of the life care planner will now involving determining with expenses are covered by ACA

Probability of another recession: 1.34% according to the Federal Reserve Bank of St. Louis

Economists at the St. Louis Fed periodically estimate the probability of a U.S. recession.  The econometric model that they use incorporates monthly data on non-farm payroll employment, industrial production,  personal income,  manufacturing sales,  and trade sales.  The model was fairly successful at predicting the most recent recession in 2008.   See graph below.


recessiongraph

U.S. Recession Probabilities

http://research.stlouisfed.org/fred2/series/RECPROUSM156N?cid=33120

2013-07: 1.34 Percent

2013-06: 0.66
2013-05: 0.36
2013-04: 0.58
2013-03: 0.44

Monthly, Not Seasonally Adjusted, Updated: 2013-10-01 8:11 AM CDT


Details:

Smoothed recession probabilities for the United States are obtained from a dynamic-factor markov-switching model applied to four monthly coincident variables: non-farm payroll employment, the index of industrial production, real personal income excluding transfer payments, and real manufacturing and trade sales. This model was originally developed in Chauvet, M., “An Economic Characterization of Business Cycle Dynamics with Factor Structure and Regime Switching,” International Economic Review, 1998, 39, 969-996. (http://faculty.ucr.edu/~chauvet/ier.pdf)

For additional details, including an analysis of the performance of this model for dating business cycles in real time, see:
Chauvet, M. and J. Piger, “A Comparison of the Real-Time Performance of Business Cycle Dating Methods,” Journal of Business and Economic Statistics, 2008, 26, 42-49.
(http://pages.uoregon.edu/jpiger/cp_realtime_2_020907.pdf)

For additional details as to why this data revises, see FAQ 3 athttp://pages.uoregon.edu/jpiger/us_recession_probs.htm.
Unemployment rates 50 years today…

Unemployment 50 years ago today was 5.5%.

Details on how unemployment rates are calculated can be found at the Fed. Reserve  of St. Louis’ website. (http://research.stlouisfed.org/fred2/data/UNRATE.txt)

Source:              U.S. Department of Labor: Bureau of Labor Statistics
Release:             Employment Situation
Seasonal Adjustment: Seasonally Adjusted
Frequency:           Monthly
Units:               Percent
Date Range:          1948-01-01 to 2013-08-01
Last Updated:        2013-09-06 9:06 AM CDT
Notes:               The unemployment rate represents the number of unemployed as a
                     percentage of the labor force. Labor force data are restricted to
                     people 16 years of age and older, who currently reside in 1 of the 50
                     states or the District of Columbia, who do not reside in institutions
                     (e.g., penal and mental facilities, homes for the aged), and who are
                     not on active duty in the Armed Forces.

                     This rate is also defined as the U-3 measure of labor
                     underutilization.