Evidence based on Data Analytics hinges on the relevance of its underlying sources. Determining what potential data sources can prove is as important as generating an analysis. The first question should be “What claims do I want to assert with data?” The type of case and nature of the complaint should inform litigants where they should start looking in discovery. For example, a dataset of billing information could determine whether or not a healthcare provider committed fraud. Structured data sources like Excel files, SQL servers, or third party databases (e.x. Oracle), are the primary source material for statistical analyses, particularly those using transactional data.
In discovery, it’s important that both parties be aware of these structured data sources. Often, these sources do not have a single designated custodian, rather they may be the purview of siloed departments or an IT group. For any particular analysis, rarely is all the necessary data all held in one place. Identifying valuable source material is more difficult as the complexity of interactions between different sources increases. To efficiently stitch together smaller databases and tables, a party should conduct detailed data mapping by identifying links between structured data sources. For example, how two tables relate to another, how a SQL table relates to an Excel file, or how a data cube relates to a cloud file. Data mapping identifies which structured data sources are directly linked to one another through their variables, and how they as a whole fit together in an analysis.
However when using data based evidence to answer a question, structured data is rarely clean and/or well organized. Variables defined in a table may be underutilized or unused. Legacy files imported into newer systems can become corrupted. The originators of macros or scripts for data pulls may no longer work for an organization and forgo detailed instructions. Sometimes the data simply do not exist: not from a party burying evidence, but by the very nature of electronically stored information (ESI).
Any defensible analysis is inherently limited by what data is available. With data analytics the maxim “evidence of absence, is not absence of evidence,” is apparent. It’s always more dangerous to exaggerate or generalize from the available data than to produce a narrow, but statistically sound result. Thus, given the data available, what questions can be asked? What questions can be answered? Finally, if there is no data, does it mean there is no problem?

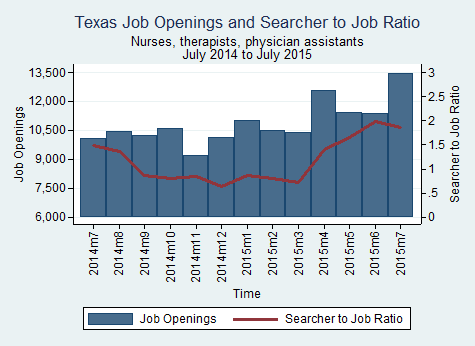
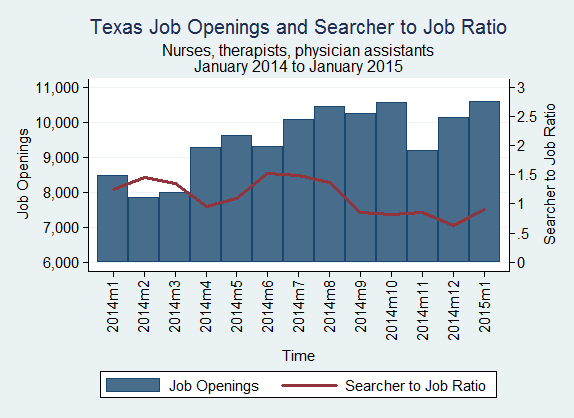
 The health care and social assistance industry gained 9,200 jobs from August 2015 to September 2015. Compared to September 2014, the cumulative number of jobs added in this industry is 67,000, an annual increase of 5.0%.

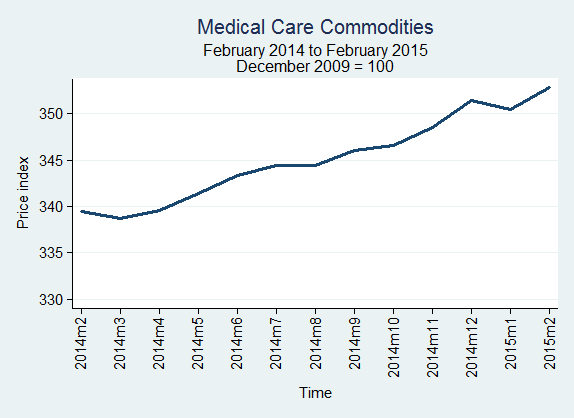
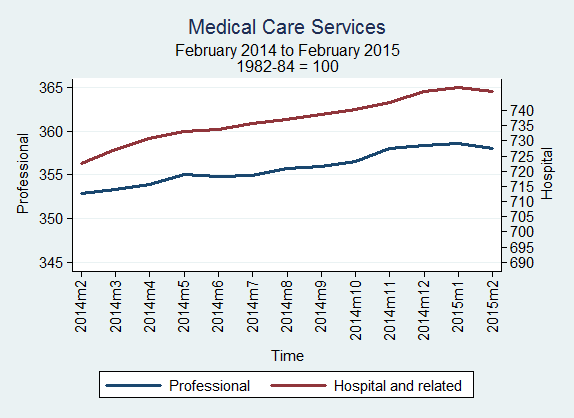
 The consumer price index (CPI) went up from 234.677 in January 2015 to 235.186 in February 2015, an annualized rate of 2.60%.