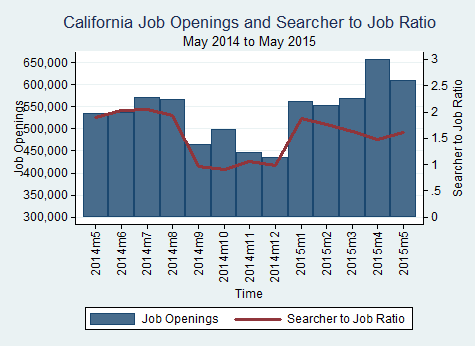
The number of job openings in California decreased from 657,459 in April 2015 to 610,591 in May 2015. The median number of job searchers per job opening across all MSAs (metropolitan statistical areas) and occupations in California increased from 1.48 in April 2015 to 1.62 in May 2015.
Tag: job openings
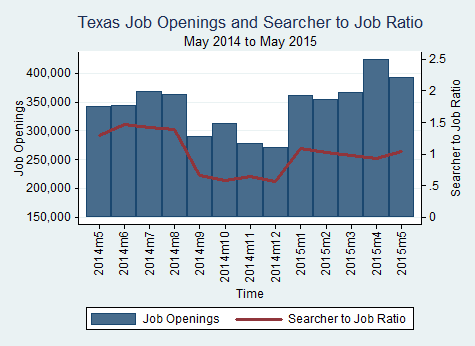
Texas job openings decreased from April to May
The number of job openings in Texas decreased from 424,525 in April 2015 to 393,563 in May 2015. The median number of job searchers per job opening across all MSAs (metropolitan statistical areas) and occupations in Texas increased from 0.93 in April 2015 to 1.04 in May 2015.
Source: BLS
4 Largest Texas MSAs see decrease in job openings in May
All four largest MSAs (metropolitan statistical areas) in Texas experienced a decrease in job openings from April 2015 to May 2015.
Dallas
Dallas experienced a decrease of 8,156 job openings from April 2015 to May 2015, a 7.56% decrease.
| Date | Total Openings | Monthly Change | Yearly Change |
| May-15 | 99,685 | -7.56% | 17.59% |
| Apr-15 | 107,841 | 16.39% | 27.58% |
| Mar-15 | 92,653 | 2.87% | 3.43% |
| Feb-15 | 90,072 | -1.85% | 23.93% |
| Jan-15 | 91,770 | 38.18% | 29.39% |
| Dec-14 | 66,413 | -4.20% | -11.31% |
| Nov-14 | 69,326 | -10.74% | 11.28% |
| Oct-14 | 77,670 | 8.74% | 19.49% |
| Sep-14 | 71,430 | -20.43% | -6.57% |
| Aug-14 | 89,770 | -0.90% | 27.29% |
| Jul-14 | 90,586 | 6.86% | 28.67% |
| Jun-14 | 84,771 | 0.29% | 15.23% |
Austin
Austin experienced a decrease of 3,174 job openings from April 2015 to May 2015, a 6.97% decrease.
| Date | Total Openings | Monthly Change | Yearly Change |
| May-15 | 42,340 | -6.97% | 15.22% |
| Apr-15 | 45,514 | 15.12% | 25.63% |
| Mar-15 | 39,536 | 3.03% | 4.12% |
| Feb-15 | 38,372 | -1.78% | 23.78% |
| Jan-15 | 39,066 | 26.19% | 28.32% |
| Dec-14 | 30,957 | -1.84% | -2.14% |
| Nov-14 | 31,539 | -9.03% | 18.96% |
| Oct-14 | 34,670 | 7.17% | 24.53% |
| Sep-14 | 32,352 | -15.59% | -0.45% |
| Aug-14 | 38,327 | -1.57% | 28.78% |
| Jul-14 | 38,938 | 5.96% | 28.50% |
| Jun-14 | 36,748 | 1.44% | 15.98% |
Houston
Houston experienced a decrease of 6,822 job openings from April 2015 to May 2015, a 7.15% decrease.
| Date | Total Openings | Monthly Change | Yearly Change |
| May-15 | 88,612 | -7.15% | 17.32% |
| Apr-15 | 95,434 | 15.36% | 26.24% |
| Mar-15 | 82,726 | 3.76% | 3.78% |
| Feb-15 | 79,730 | -2.12% | 20.96% |
| Jan-15 | 81,454 | 35.88% | 28.02% |
| Dec-14 | 59,945 | -3.04% | -10.92% |
| Nov-14 | 61,824 | -11.15% | 10.35% |
| Oct-14 | 69,582 | 8.73% | 19.68% |
| Sep-14 | 63,998 | -20.30% | -5.99% |
| Aug-14 | 80,299 | -1.83% | 27.86% |
| Jul-14 | 81,792 | 8.29% | 29.66% |
| Jun-14 | 75,527 | -0.09% | 14.68% |
San Antonio
San Antonio experienced a decrease of 3,416 job openings from April 2015 to May 2015, a 8.05% decrease.
| Date | Total Openings | Monthly Change | Yearly Change |
| May-15 | 39,009 | -8.05% | 14.34% |
| Apr-15 | 42,425 | 16.19% | 24.67% |
| Mar-15 | 36,512 | 2.73% | 1.38% |
| Feb-15 | 35,543 | -1.08% | 22.30% |
| Jan-15 | 35,932 | 34.70% | 26.88% |
| Dec-14 | 26,676 | -3.61% | -10.95% |
| Nov-14 | 27,676 | -11.80% | 12.69% |
| Oct-14 | 31,377 | 8.93% | 21.21% |
| Sep-14 | 28,805 | -20.44% | -4.98% |
| Aug-14 | 36,207 | 0.12% | 27.65% |
| Jul-14 | 36,164 | 6.00% | 27.85% |
| Jun-14 | 34,117 | 0.26% | 15.48% |
Source: BLS
4 largest California MSAs see decrease in job openings for May
All 4 of the largest MSAs (metropolitan statistical areas) in California experienced a decrease in job openings for the month of May.
Los Angeles-Long Beach-Anaheim
The Los Angeles-Long Beach-Anaheim MSA experienced a decrease of 12,517 job openings in May 2015, a 7.61% change from April 2015.
| Month | Total Openings | Percent Monthly Change |
| Jun-14 | 129,782 | 0.19 |
| Jul-14 | 137,333 | 5.82 |
| Aug-14 | 136,939 | -0.29 |
| Sep-14 | 112,657 | -17.73 |
| Oct-14 | 121,598 | 7.94 |
| Nov-14 | 108,123 | -11.08 |
| Dec-14 | 104,302 | -3.53 |
| Jan-15 | 140,013 | 34.24 |
| Feb-15 | 137,967 | -1.46 |
| Mar-15 | 141,983 | 2.91 |
| Apr-15 | 164,525 | 15.88 |
| May-15 | 152,008 | -7.61 |
San Francisco-Oakland-Fremont
The San Francisco-Oakland-Fremont MSA experienced a decrease of 6,240 job openings in May 2015, an 7.39% change from April 2015.
| Month | Total Openings | Percent Monthly Change |
| Jun-14 | 66,213 | 0.65 |
| Jul-14 | 69,790 | 5.4 |
| Aug-14 | 69,209 | -0.83 |
| Sep-14 | 58,567 | -15.38 |
| Oct-14 | 63,065 | 7.68 |
| Nov-14 | 56,940 | -9.71 |
| Dec-14 | 54,986 | -3.43 |
| Jan-15 | 72,089 | 31.11 |
| Feb-15 | 70,884 | -1.67 |
| Mar-15 | 72,887 | 2.83 |
| Apr-15 | 84,472 | 15.89 |
| May-15 | 78,232 | -7.39 |
Riverside-San Bernardino-Ontario
The Riverside-San Bernardino-Ontario MSA experienced a decrease of 4,167 job openings in May 2015, an 6.72% change from April 2015.
| Month | Total Openings | Percent Monthly Change |
| Jun-14 | 49,141 | 0.42 |
| Jul-14 | 52,360 | 6.55 |
| Aug-14 | 51,924 | -0.83 |
| Sep-14 | 40,018 | -22.93 |
| Oct-14 | 42,870 | 7.13 |
| Nov-14 | 38,138 | -11.04 |
| Dec-14 | 37,377 | -2.00 |
| Jan-15 | 52,811 | 41.29 |
| Feb-15 | 52,141 | -1.27 |
| Mar-15 | 53,849 | 3.27 |
| Apr-15 | 62,004 | 15.15 |
| May-15 | 57,837 | -6.72 |
San Diego-Carlsbad-San Marcos
The San Diego-Carlsbad-San Marcos MSA experienced a decrease of 4,027 job openings in May 2015, an 6.97% change from April 2015.
| Month | Total Openings | Percent Monthly Change |
| Jun-14 | 46,681 | 0.71 |
| Jul-14 | 49,258 | 5.52 |
| Aug-14 | 49,007 | -0.51 |
| Sep-14 | 41,343 | -15.64 |
| Oct-14 | 44,408 | 7.41 |
| Nov-14 | 39,956 | -10.02 |
| Dec-14 | 38,937 | -2.55 |
| Jan-15 | 49,272 | 26.54 |
| Feb-15 | 48,492 | -1.58 |
| Mar-15 | 49,955 | 3.02 |
| Apr-15 | 57,749 | 15.6 |
| May-15 | 53,722 | -6.97 |
Source: BLS
California and Texas both saw decrease in job openings in May
California
California experienced a decrease of 46,868 job openings from April 2015 to May 2015, a 7.13% monthly decrease.
| Month | Total Openings | Monthly Change | Yearly Change |
| May 15 | 610,591 | -7.13% | 13.43% |
| Apr 15 | 657,459 | 15.57% | 22.81% |
| Mar 15 | 568,891 | 2.98% | 0.69% |
| Feb 15 | 552,422 | -1.54% | 20.46% |
| Jan 15 | 561,081 | 28.68% | 24.96% |
| Dec 14 | 436,019 | -2.52% | -6.91% |
| Nov 14 | 447,277 | -10.45% | 15.15% |
| Oct 14 | 499,494 | 7.47% | 21.56% |
| Sep 14 | 464,759 | -18.01% | -2.91% |
| Aug 14 | 566,834 | -0.67% | 27.78% |
| Jul 14 | 570,648 | 6.01% | 27.68% |
| Jun 14 | 538,310 | 0.55% | 16.09% |
Texas
Texas experienced a decrease of 30,962 job openings from April 2015 to May 2015, a 7.29% monthly decrease
| Month | Total Openings | Monthly Change | Yearly Change |
| May 15 | 393,563 | -7.29% | 14.57% |
| Apr 15 | 424,525 | 15.62% | 23.84% |
| Mar 15 | 367,183 | 3.27% | 1.54% |
| Feb 15 | 355,559 | -1.76% | 20.02% |
| Jan 15 | 361,941 | 33.63% | 25.94% |
| Dec 14 | 270,849 | -2.92% | -10.76% |
| Nov 14 | 278,989 | -11.11% | 10.78% |
| Oct 14 | 313,873 | 8.34% | 19.17% |
| Sep 14 | 289,703 | -20.46% | -5.86% |
| Aug 14 | 364,236 | -1.23% | 27.59% |
| Jul 14 | 368,784 | 7.36% | 28.75% |
| Jun 14 | 343,517 | 0.21% | 14.99% |
Police and Sheriff’s Patrol Officers experienced the largest increase of job openings nationwide for May
Police and Sheriff’s Patrol Officers experienced the largest increase of new openings of all occupations in the US for the month of May with 999 new job openings.
May 2015
| Occupation | Total Openings | New Openings |
| Police and Sheriff’s Patrol Officers | 21,181 | 999 |
Source: BLS
Bowling Green, KY experienced largest increase in job openings of all US MSAs for May
The Bowling Green, KY MSA (metropolitan statistical area) experienced the largest increase of job openings of all MSAs in the United States for the month of May with 164 new openings.
| Month | MSA | Total Openings | New Openings |
| May 2015 | Bowling Green, KY | 2,478 | 164 |
Source: BLS
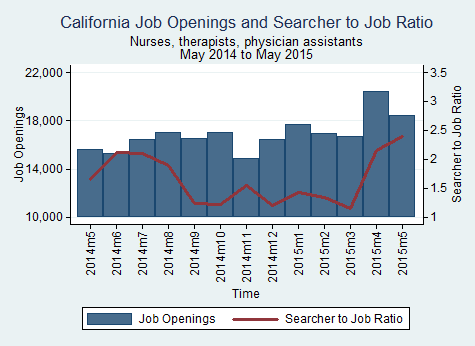
California RN’s, PA’s, and therapists see decrease in job openings from April to May

The number of job openings in California for nurses, therapists, and physician assistants decreased from 20,399 in April 2015 to 18,450 in May 2015. The searcher-to-job opening ratio increased from 2.16 to 2.39 in the same span.
Source: BLS
Image source: http://pediatric-nurse-practitioners.blogspot.com/2012/12/top-5-cardiac-care-nursing-jobs-for-we.html
California innovation job openings decreased from April to May

The number of job openings in California for “Innovation Type Jobs” decreased from 29,183 in April 2015 to 27,484 in May 2015. The searcher-to-job opening ratio increased from 1.34 to 1.40 in the same span.
Innovation jobs definition: http://www.employstats.com/blog/2014/09/26/1233/
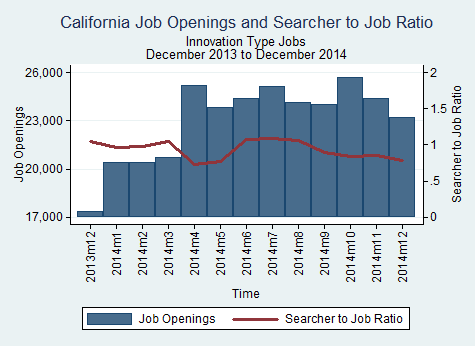
Image source: http://www.bizjournals.com/sacramento/news/2013/09/23/symposium-innovation-ecosystems-jobs-wea.html
Source: BLS
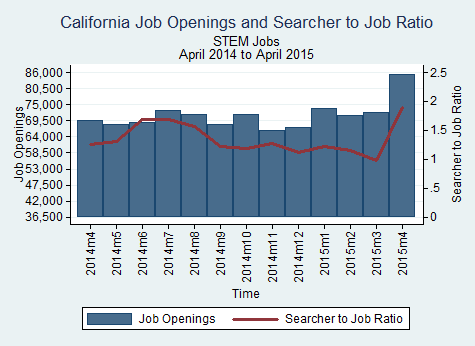
California STEM job openings increased from March to April
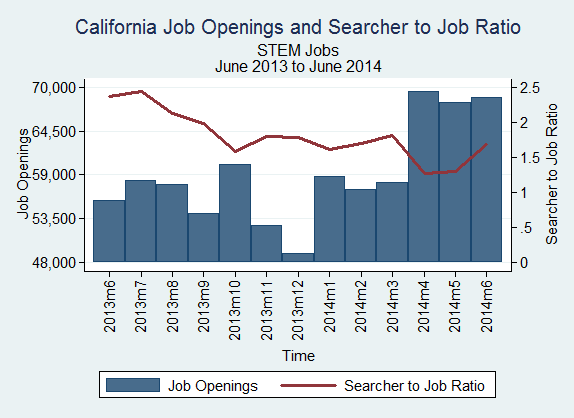
The number of job openings in California for STEM (science, technology, engineering, math) jobs increased from 72,476 in March 2015 to 85,222 in April 2015. The searcher-to-job opening ratio also increased from 0.97 to 1.89 in the same span.
Our definition of STEM jobs: http://www.employstats.com/blog/2014/09/19/growing-national-interest-in-stem-fields-has-focused-our-research/
Source: BLS
Image source: http://fairmountinc.com/help-wanted-1-2-million-good-paying-jobs-available/