In this post, we look at the weekly overtime (OT) hours typically worked by those who are in Fruit and Vegetable Preserving and Specialty Food Manufacturing.

Many of the employees that work in these jobs are not exempt from FLSA overtime pay and earn 1.5 times pay for hours worked over 40 in a given week.

The tabulations below are based on U.S. BLS survey data. The BLS job title groups are insightful, generally containing more specific job titles with similar knowledge, skills, and abilities (KSA), but can be more broad than a particular company’s job title listing. Also, some companies may have the job title listed here as exempt from FLSA or state OT due to their specific job assignments. The BLS does not make a distinction as to if the job title is exempt or non-exempt from OT.

Job Title Percent of OT Workers Average Hours of OT 1 out of every 4 (25%) OT workers works at least:
Fruit and Vegetable Preserving and Specialty Food Manufacturing 28.57% 10.67 hours 55 hours

Source: BLS (CPS March)

FLSA OT report for Plastics Product Manufacturing

Posted by Dwight Steward, Ph.D. and Ryan Willett | BLS Data, Earnings, Industry, U.S. Economy

In this post, we look at the weekly overtime (OT) hours typically worked by those who are in Plastics Product Manufacturing.

Many of the employees that work in these jobs are not exempt from FLSA overtime pay and earn 1.5 times pay for hours worked over 40 in a given week.

The tabulations below are based on U.S. BLS survey data. The BLS job title groups are insightful, generally containing more specific job titles with similar knowledge, skills, and abilities (KSA), but can be more broad than a particular company’s job title listing. Also, some companies may have the job title listed here as exempt from FLSA or state OT due to their specific job assignments. The BLS does not make a distinction as to if the job title is exempt or non-exempt from OT.

Job Title Percent of OT Workers Average Hours of OT 1 out of every 4 (25%) OT workers works at least:
Plastics Product Manufacturing 27.72% 9.32 hours 53.5 hours

Source: BLS (CPS March)

Union membership 1930-2012. Source: The Heritage Foundation

U.S. BLS reports that membership in unions was pretty much unchanged from 2012.  In 2013, 11.3% of wage and salary workers, or about 14.5 million workers, were in a union.  Highlights from the BLS data release include:

  • Public sector workers were more than 5 x more likely to be unionized.
  • Within the public sector, education, police, and firefighters had the highest level of unionization at over 35%
  • New York state had the highest level of unionization at over 24%
  • Union workers on average earned about $200 more per week than non-union workers ($950 v. $750)

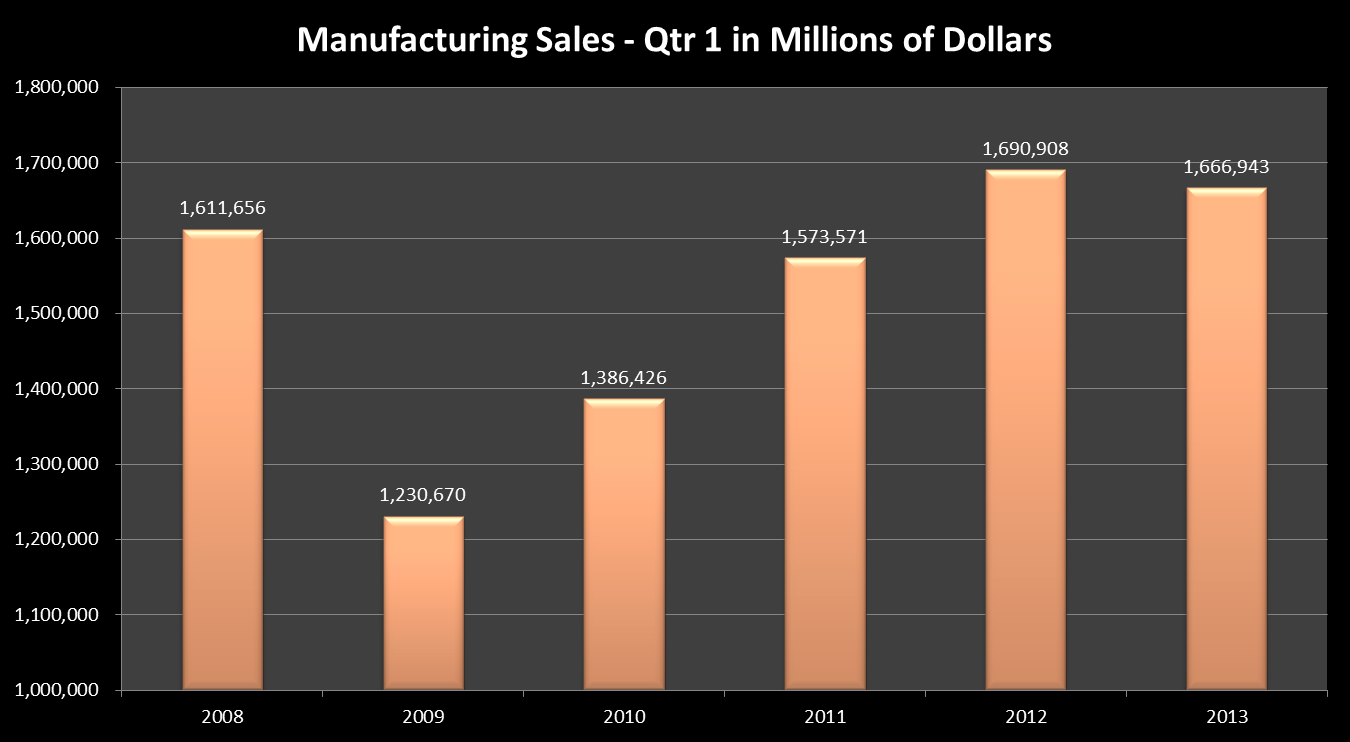
No matter what data you look at, manufacturing in the U.S. continues to increase.   Sales for all U.S. manufacturers exceeded $1.69 trillion in the 1st quarter of 2012.  In comparison, 1st quarter sales of manufacturing goods had falling to about $1.2  trillion at the deepest point of the ‘great recession’ in 2009.

Manufacturing levels have reached, and slightly exceeded  pre-recession economic output in nominal or non-inflation adjusted terms.  Before the recession, manufacturing 1st quarter sales were at $1.6 trillion in nominal or non-inflation adjusted terms.

manufacturing


So where is a good source for manufacturing output information?

http://www.census.gov/econ/manufacturing.html

The U.S. Census industry portal is also a good source

http://www.census.gov/econ/isp/


Multi-ethnic workers wearing hardhats

Manufacturing on the rise in U.S.

Source: U.S. Department of Commerce, Economics and Statistics Adminstration

U.S.  Department of Commerce reports manufacturing wages and employment continues to rise the U.S. The new study uses a relatively new data source, the Quarterly Workforce Indicators (QWI), to analyze the earnings of new hires relative to incumbent workers in both manufacturing and non-manufacturing.

They find that new hires in the manufacturing sector earn more than new hires in other industries and have done particularly well since the recession began.

Highlight from the study include:

  • New hires in manufacturing enjoy an earnings premium relative to other new hires.  T
  • At the end of 2011, the ratio of new hire earnings to incumbent earnings was about 8 percentage points higher in manufacturing than in other industries.
  • Over time, the earnings of new hires relative to incumbents have been consistently higher in manufacturing.
  • Since the recession began, real average earnings for new hires in manufacturing grew 3.5 percent, while earnings of incumbents in manufacturing grew about 2.4 percent.