Big Data permeates our society, but how will it affect U.S. courts? In civil litigation, attorneys and experts are increasingly reliant on analyzing of large volumes of electronic data, which provide information and insight into legal disputes that could not be obtained through traditional sources. There are limitless sources of Big Data: time and payroll records, medical reimbursements, stock prices, GPS histories, job openings, credit data, sales receipts, and social media posts just to name a few. Experts must navigate complex databases and often messy data to generate reliable quantitative results. Attorneys must always keep an eye on how such evidence is used at trial. Big Data analyses also present new legal and public policy challenges in areas like privacy and cybersecurity, while advances continue in artificial intelligence and algorithmic design. For these and many other topics, Employstats has a roadmap on the past, present, and future of Big Data in our legal system.
Tag: Statistics
Simpson’s Paradox in Action
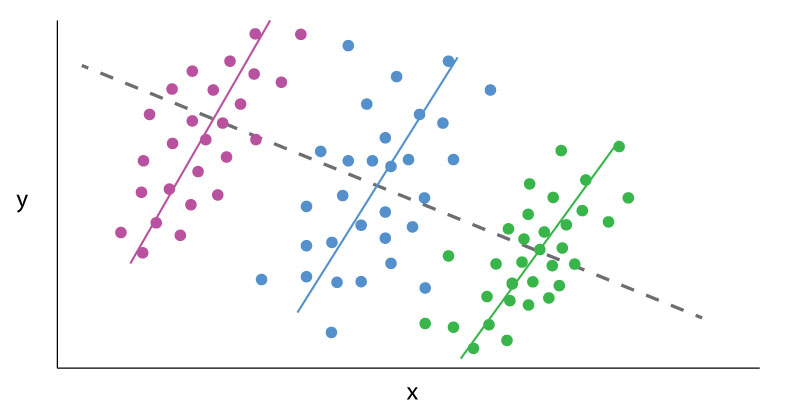
Data Analytics can sometimes be a frustrating game of smoke and mirrors, where outputs change based on the tiniest alterations in perspective. The classic example is Simpson’s paradox.
Simpson’s paradox is a common statistical phenomenon which occurs whenever high-level and subdivided data produce different findings. The data itself may be error free, but how one looks at it may lead to contradictory conclusions. A dataset results in a Simpson’s paradox when a “higher level” data cut reveals one finding, which is reversed at a “lower level” data cut. Famous examples include acceptance rates by gender to a college, which vary by academic department, or mortality rates for certain medical procedures, which vary based on the severity of the medical case. The presence of such a paradox does not mean one conclusion is necessarily wrong; rather, the presence of a paradox in the data warrants further investigation.
“Lurking variables” (or “confounding variables”) are one key to understanding Simpson’s paradox. Lurking variables are those which significantly affect variables of interest, like the outputs in a data set, but which are not controlled for in an analysis. These lurking variables often bias analytical outputs and exaggerate correlations. However, improperly “stratifying data” is also key to Simpson’s paradox. Aggressively sub-dividing data into statistically insignificant groupings or controlling for unrelated variables can generate inconclusive findings. Both forces operate in opposing directions. The solution to the paradox is to find the data cut which is most relevant to answering the given question, after controlling for significant variables.
EmployStats recently worked on an arbitration case out of Massachusetts, where the Plaintiffs alleged that a new evaluation system negatively impacted older and minority teachers more than their peers in a major public school district. One report provided by the Defense examined individual evaluators in individual years, arguing that evaluators were responsible for determining the outcome of teacher evaluations. This report determined, based on that data cut, the new evaluation system showed no statistical signs of bias. By contrast, the EmployStats team systematically analyzed all evaluations, controlling for different factors such as teacher experience, the type of school, and student demographics. The team found that the evaluations, at an overall level and after controlling for a variety of variables, demonstrated a statistically significant pattern of biases against older and minority teachers.
The EmployStats team then examined the Defense’s report. The team found that if all the evalulator’s results were jointly tested, the results showed strong, statistically significant biases against older and minority teachers, which matched the Plaintiff’s assertions. If the evaluators really were a lurking variable, then specific evaluators should have driven a significant number of results. Instead, the data supported the hypothesis that the evaluation system itself was the cause of signs of bias.
To see how EmployStats can assist you with similar statistics cases, please visit www.EmployStats.com or give us a call at 512-476-3711. Follow our blog and find us on social media: @employstatsnews

Benford’s Law and Fraud Detection
Civil fraud cases hinge on litigants proving where specific fraudulent activity occurred. Tax returns, sales records, expense reports, or any other large financial data set can be manipulated. In many instances of fraud, the accused party diverts funds or creates transactions, intending to make their fraud appear as ordinary or random entries. More clever fraudsters ensure no values are duplicated or input highly specific dollar and cent amounts. Such ‘random’ numbers, to them, may appear normal, but few understand or replicate the natural distribution of numbers known as Benford’s Law.
A staple of forensic accounting, Benford’s Law is a useful tool for litigants in establishing patterns of fraudulent activity.
Benford’s Law states that, for any data set of numbers, the number 1 will be the leading numeral about 30% of the time, the number 2 will be the leading numeral about 18% of the time, and each subsequent number (3-9) will be a leading number with decreasing frequency. This decreasing frequency of numbers, from 1 though 9, can be represented by a curve that looks like this:
For example, according to Benford’s Law, one would expect that more street addresses start with a 1 than a 8 or 3; such hypothesis can be tested and proven. The same pattern holds for any number of phenomenon: country populations, telephone numbers, passengers on a plane, or the volumes of trades. This predicted distribution permeates many aspects of numbers and big data sets. But Benford’s Law is not absolute: it does require larger data sets, and that all the leading digits (1-9) must have a theoretically equal chance of being the leading digit. Benford’s Law, for example, would not apply to a data set where only 4s or 9s are the leading number. Financial data sets do comport with a Benford distribution.
In accounting and financial auditing, Benford’s Law is used to test a data set’s authenticity. False transaction data is typically tampered by changing values or adding additional fake data. The test, therefore, is an early indicator if a data set has been altered or artificially created. Computer generated random numbers will tend to show an equal distribution of leading digits. Even manually created false entries will tend to have some sort of underlying pattern. A person may, for example, input more fake leading digits based on numbers closer to their typing fingers (5 and 6).
An examiner would compare the distribution of leading digits in the data set, and the Benford distrubtion. Then, the examiner would statistically test if the proportion of leading numbers in the data set matches a Benford distribution. The resulting “Z-scores” give a measure of how distorted these distributions are, with higher “Z-scores” implying a more distorted data set, which implies artificially created data.
If a data set violates Benford’s Law, that alone does not prove such transactions numbers fraudulent. But, a violation does give auditors, economists, and fact finders an additional reason to scrutinize individual transactions.