Source: NY TImes

A recent article in the New York Times explored the brewing debate concerning the current U.S, ban on exporting oil outside of the U.S.

In a nutshell, the producers want to export oil while the refiners want to keep the oil in the US

The refiners:  The refiners want to keep the oil in the US so they have more oil to refine.  Keeping the oil in the U.S. also keeps refining competition from abroad in check.

Keeping the export ban would possibly lower prices for oil and gas products, refiners argue.  To refiners exporting oil cuts into their bottom line.

Oil producers: On the other side of the equation the oil producers are concerned that having the restriction to only selling the United States will eventually lower their profits by reducing the price of crude oil in the U.S.

Natural gas in the price of natural gas has seen that same type of phenomena over the last decade as Shale and hydro-fracturing has led to much lower natural gas prices in the US

The concern among oil producers is that the lower price (that results from the export ban) would eventually cut into their bottom line as more and more crude oil is put on the market with the new discoveries in South Texas and other places in the United States

In the long run producers are concerned that there would be an exit of producers and or a reduction of new finds in the United States. Since the price that they would receive for crude oil would be lower.

The natural gas market is a good example of the potential impact that crude oil producer see. The natural gas industry faced and continues to face lower prices in part due to the fact that it is not as easy to export natural gas.  As a result of not being able to export natural gas readily from United States the large number of hydro-fracturing finds in the United States have stayed in United States. As a result the price of natural gas products has fallen. That is clearly the concern that is clearly the concern of the crude oil producers in United States.

fredgraphWhy the economic doom and gloom?  St. Louis Fed puts the probability of another recession at near zero percent!

Actually a number of studies on consumer sentiment are painting a similar picture of optimism for the economy in the coming months.  See for example the Roanke University study.

Details on the Recession graph and data calculations from FRED:

Notes:

Smoothed recession probabilities for the United States are obtained from a dynamic-factor markov-switching model applied to four monthly coincident variables: non-farm payroll employment, the index of industrial production, real personal income excluding transfer payments, and real manufacturing and trade sales. This model was originally developed in Chauvet, M., “An Economic Characterization of Business Cycle Dynamics with Factor Structure and Regime Switching,” International Economic Review, 1998, 39, 969-996. (http://faculty.ucr.edu/~chauvet/ier.pdf)

For additional details, including an analysis of the performance of this model for dating business cycles in real time, see:
Chauvet, M. and J. Piger, “A Comparison of the Real-Time Performance of Business Cycle Dating Methods,” Journal of Business and Economic Statistics, 2008, 26, 42-49.
(http://pages.uoregon.edu/jpiger/cp_realtime_2_020907.pdf)

For additional details as to why this data revises, see FAQ 3 athttp://pages.uoregon.edu/jpiger/us_recession_probs.htm.


Data released by the credit giant TransUnion indicates that :

The mortgage delinquency rate (the rate of borrowers 60 days or more delinquent on their mortgages) dropped below 4% for the first time since 2008, ending Q4 2013 at 3.85%.

The mortgage delinquency rate declined for the eighth consecutive quarter from 4.09% in Q3 2013 while dropping more than 24% from one year earlier (5.08% in Q4 2012).


The study also found:

  • Florida, NJ continued to have a higher mortgage delinquency rate at 8.18% and 7.60%
  • Nevada saw the rate of delinquencies fall by over a third (9.98% to 6.52%)

Austin American Statesman reports that, Arnold Oil is moving out of East Austin and will move into a industrial area near the airport.

Co-owner Jim Arnold said the company needs more space and that what started as a two-man operation has outgrown Central East Austin, and vice versa. “I said there will come a time when this business will no longer have a place in East Austin, and that time has come,” Arnold said Tuesday. “We need to expand … and this doesn’t belong in East Austin on Friday nights and Saturday nights. It’s a changed place.”

The area east of I-35 in Austin,  continues to change economically and culturally.  Since the 1990 the area has renovated older housing stock, added housing and new businesses.  A study by the UT-Austin LBJ School done in 2007 documents some of these changes.  Recent activity has only continued the trends identified in the study.

Here are a few of the highlights:

  • There is a significant demographic change in the racial and ethnic composition of East Austin
  • There is overall increase in median family income and decrease in poverty levels in East Austin
  • East Austin’s population is becoming younger and better educated.
  • There is a substantial increase in housing values


The New York Fed surveys over 1,500 small firms twice a year about their financing and credit needs. Responses to the Small Business Credit.  (It would be nice for the other Fed banks to do a similar study, hint, hint)

In the Q4 2013 survey, a weighted to be a statistically representative sample of firms in New York, New Jersey, Connecticut, and Pennsylvania reported on their business performance and credit
experiences in the first half of 2013 and their outlook for the first half of 2014.

Here are the highlights.

  • Firm outlook is positive for Q1 and Q2 2014: more than 50% expect rev. to increase and 30% expect to add employees
  • Firms report small credit needs and high search costs: most sought loans <$100k; more than 26 hours spent on the search
  • Managing uneven cash flow dominates firm concerns
  • More experience and success correlated with more favorable credit experience


Union membership 1930-2012. Source: The Heritage Foundation

U.S. BLS reports that membership in unions was pretty much unchanged from 2012.  In 2013, 11.3% of wage and salary workers, or about 14.5 million workers, were in a union.  Highlights from the BLS data release include:

  • Public sector workers were more than 5 x more likely to be unionized.
  • Within the public sector, education, police, and firefighters had the highest level of unionization at over 35%
  • New York state had the highest level of unionization at over 24%
  • Union workers on average earned about $200 more per week than non-union workers ($950 v. $750)

Total number of workers in U.S. workforce then, now and the future

1992

2002

2012

128,105,000

144,863,000

154,975,000

Hottest Occupational Groups

2012-22 Growth

Three hot jobs for the next decade

  1. Personal Care Aides
  2. Medical Secretaries
  3. Registered Nurses


What is that loud sucking sound? 

According to a Banco de Mexico study it is the sound of U.S. employers pulling workers up from Mexico.

Daniel Chiquiar and Alejandrina Salcedo of the Banco de Mexico present a study of the underlying economic factors and future immigration flow scenarios for Mexico to U.S. immigration.   They find evidence that of an across‐the‐board increase in the quantity of Mexican labor demanded in US, especially in construction, is a an important driving factor. Their study looks at the intensity of Mexican labor demand versus U.S. workers, i.e. the employment of Mexican immigrants relative to other U.S. workers in the industry.

They also provide projections of future Mexico-U.S. immigration.  Their work  suggests that for the 2011‐17 period, net inflows of all types of workers (legal and unauthorized) from Mexico to the United States could be on the order of 260,000 persons per year.   Their work suggest that future net inflow will be less than the net inflow of Mexicans during 1990‐2000, which was about 466,000 workers annually. If certain sectors in the U.S. such as construction were to experience large growth the net inflow could reach as much as 330,000 workers per year.


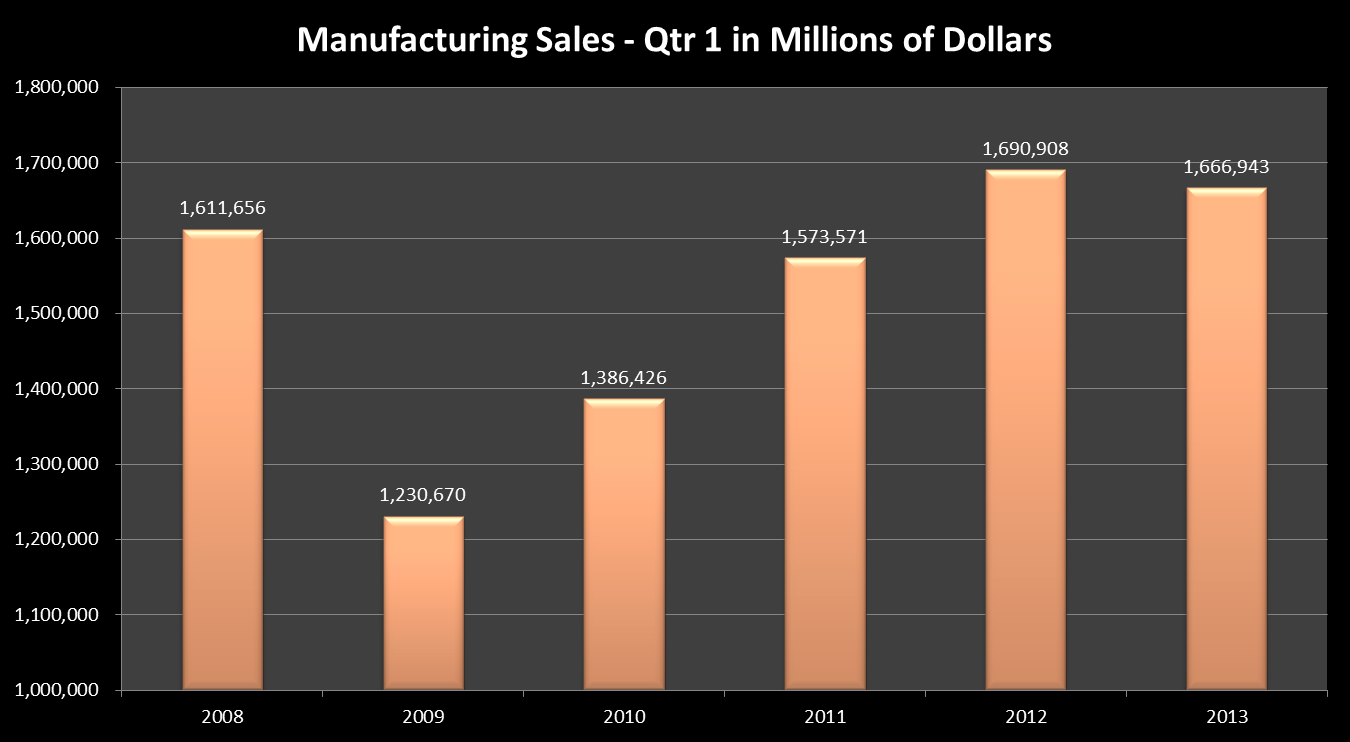
No matter what data you look at, manufacturing in the U.S. continues to increase.   Sales for all U.S. manufacturers exceeded $1.69 trillion in the 1st quarter of 2012.  In comparison, 1st quarter sales of manufacturing goods had falling to about $1.2  trillion at the deepest point of the ‘great recession’ in 2009.

Manufacturing levels have reached, and slightly exceeded  pre-recession economic output in nominal or non-inflation adjusted terms.  Before the recession, manufacturing 1st quarter sales were at $1.6 trillion in nominal or non-inflation adjusted terms.

manufacturing


So where is a good source for manufacturing output information?

http://www.census.gov/econ/manufacturing.html

The U.S. Census industry portal is also a good source

http://www.census.gov/econ/isp/