Top 3 highest wage, sub-$100K STEM jobs in Texas

Posted by Dwight Steward, Ph.D. and Ryan Willett | BLS Data, Earnings

The top 3 STEM highest paying occupations in Texas are Electrical and Electronic Engineers, Engineers, all other, and Nurse Midwives and Nurse Practitioners.

Occupation Average Annual Wage
Electrical and Electronic Engineers $99,888.89
Engineers, all other $98,285.71
Nurse Midwives and Nurse Practitioners $97,333.34

Our definition of STEM jobs: http://www.employstats.com/blog/2014/09/19/growing-national-interest-in-stem-fields-has-focused-our-research/

The data was pulled from the CPS (Current Population Survey) March.

Source: BLS

Image Source: http://www.coursetalk.com/coursera/fundamentals-of-electrical-engineering

Some employers, both private and public, are moving towards making employee’s salaries public.  “Making Pay Public” by Tamara Lytle , in HR Magazine, September 2014. discusses the recent trend of employers making employee’s salaries more open.

Some employers such as, Buffer, are going so far as to not only making their salaries public, but are also providing details on the decision process by which the employee’s  salary was determined. For example, Buffer’s salary formula has set factors that take into account the employee’s job type, seniority, experience, location, and equity versus salary choice.

In the formula, engineers and designers have a base salary of $60.000 while content crafters have a base salary of $50,000.  Employees in Austin receive a $12,000 salary kicker, while employees in San Franciso receive a $22,000 salary kicker.   Buffer’s (and other’s) approach to salary is clearly a different approach from how some employers had pay discussions in the past.

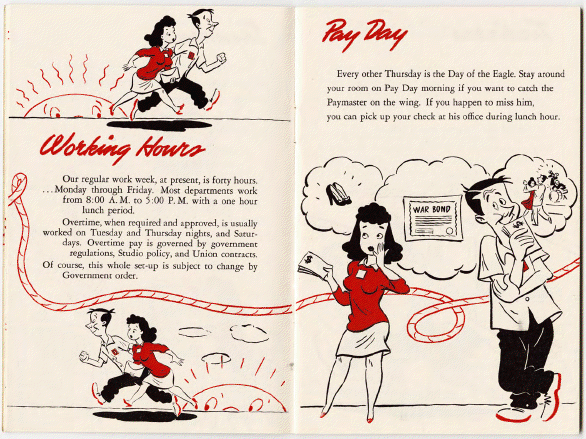
A 1943 HR Manual from Disney:


The short answer is:  Generally no they do not get rolled into the regular rate of pay for the purpose of calculating an employee’s overtime (OT).  However, calculating the applicable regular rate of pay to be used in calculating overtime for a tip employee is a little different from that of non-tipped employees.

To illustrate, consider the following Midwestern restaurant chain.  The manager of one of the  regions is reviewing its overtime policy for its tipped employees.

FLSA allows tipped employees to be paid less than the minimum wage. In this state, like the federal law, tipped employees are paid a minimum of $2.13 per hour. In the state employers.  Employers of tipped employees can claim a tip credit up to the difference between the cash payment requirement of $2.13 and the minimum wage of $7.25.  So in this state the employer can take a maximum tip credit of $5.12 ($7.25 – $2.13).

The restaurant pays its employees a rate less than minimum. (The employees of course continue to work at the location because of the tips that they earn as waiters and servers!) The restaurant claims a tip credit of $5.12 per hour.   In the chain, the restaurant employees retain all their tips as required by FLSA, but they do take part in a valid tip pooling arrangement with other employees (bussers and service bartenders in this case example)  who regularly receive tips.

How NOT to calculate the OT rate for its tipped employees:

Unlike its non-tipped employees, the restaurant can not simply pay its tipped employees an overtime rate equal to 1.5 times the employees hourly rate.  That is the employer can not simply pay $3.20 per hour ($2.13 x 1.5) for the employees OT.

How to calculate the OT rate for its tipped employees:

So in this example, the employee’s OT rate should by $5.76 for hours worked over 40 in a week.

Fed. Min. Wage: $7.25

OT rate: 1.5

OT Hourly Rate:  $10.88 ($7.25 x 1.5)

minus employer tip credit: $5.12 ($7.25-$2.13)

OT rate for tipped employees : $5.76

So in practice, the actual OT rate will vary by state since different states have different minimums. However, in general the calculation follows as above.

Resources:

Fact Sheet #15: Tipped Employees Under the Fair Labor Standards Act (FLSA) 

California Tipped Employees


The following states raised their minimum wage in 2014:

Connecticut: Connecticut’s hourly minimum wage will increase incrementally to $10.10 over the next three years.

Delaware: Delaware’s minimum wage will increase to $8.25 an hour, effective June 1, 2015.

Hawaii: Hawaii’s minimum wage will increase to $10.10 per hour over the next four years.

Maryland: Maryland raised its minimum wage to $10.10 an hour by July 2018

Massachusetts: A new law will gradually raise the minimum wage in the state to $11 per hour by 2017,

MichiganA new law will increase the state’s minimum hourly wage to $9.25 per hour by Jan. 1, 2018

Minnesota: The state’s minimum wage increased on Aug. 1, 2014, to $8 per hour for large employers (>$500k in gross sales).  to $9.50 on Aug. 1, 2016. Beginning in 2018, the wage will be indexed to inflation to a maximum increase of 2.5 percent per year.

Rhode Island: The state’s minimum wage will increase to $9 per hour, effective Jan. 1, 2015.

Vermont: The state’s minimum wage will rise to $10.50 an hour by 2018.  After 2018, annual cost-of-living increases of either 5 percent or if it is lower, a rate calculated by the federal Department of Labor annually that is tied to the consumer price index.

West Virginia: The state’s hourly minimum wage will increase to $8 on Jan. 1, 2015, and increase to $8.75 the following Jan. 1, 2016.

Washington, D.C.: The Minimum Wage Amendment Act of 2013 will increase the district’s minimum hourly wage in three steps to $11.50 by July 1, 2016

-See more at: http://www.shrm.org/legalissues/stateandlocalresources/pages/states-minimum-wage-2014.aspx#sthash.YFK7jjgC.dpuf


assemblers2


The graph above shows the expected lifetime earnings of a person working as a manufacturing assembler.  The red line shows the earnings that a person who began working as a manufacturing assembler in 2006 could expect over their projected work life of approximately 44 years.   The blue line shows the earnings that a person who began working as a manufacturing assembler in 2010 could expect over a projected work life of approximately 44 years.  Both projected earnings streams account for projected inflation.

The work life earnings for manufacturing assemblers, projected using a life cycle labor market model, show that after the Great Recession these types of workers can expect both lower annual earnings and wage increases over their projected working life.

Methodology:

The projected earnings profiles are constructed from statistical models based on the Current Population Survey (CPS) labor market data from the U.S. Bureau of Labor Statistics (BLS).  The earnings profiles for assembly workers are based on the earnings of high school educated white male assemblers and fabricators, working full-time or part-time, in 2006 and 2010.

Total number of workers in U.S. workforce then, now and the future

1992

2002

2012

128,105,000

144,863,000

154,975,000

Hottest Occupational Groups

2012-22 Growth

Three hot jobs for the next decade

  1. Personal Care Aides
  2. Medical Secretaries
  3. Registered Nurses


Multi-ethnic workers wearing hardhats

Manufacturing on the rise in U.S.

Source: U.S. Department of Commerce, Economics and Statistics Adminstration

U.S.  Department of Commerce reports manufacturing wages and employment continues to rise the U.S. The new study uses a relatively new data source, the Quarterly Workforce Indicators (QWI), to analyze the earnings of new hires relative to incumbent workers in both manufacturing and non-manufacturing.

They find that new hires in the manufacturing sector earn more than new hires in other industries and have done particularly well since the recession began.

Highlight from the study include:

  • New hires in manufacturing enjoy an earnings premium relative to other new hires.  T
  • At the end of 2011, the ratio of new hire earnings to incumbent earnings was about 8 percentage points higher in manufacturing than in other industries.
  • Over time, the earnings of new hires relative to incumbents have been consistently higher in manufacturing.
  • Since the recession began, real average earnings for new hires in manufacturing grew 3.5 percent, while earnings of incumbents in manufacturing grew about 2.4 percent.