Healthcare jobs increased from June 2014 to July 2014

healthcareThe health care and social assistance industry gained 100 jobs from June 2014 to July 2014. Compared to July 2013, the cumulative number of jobs added in this industry is 33,300, an annual increase of 2.5%.

Image source: http://blogs.wsj.com/health/2012/01/06/health-care-sector-adds-jobs-as-overall-employment-picture-looks-healthier/

Median rent and housing prices on average increased for three largest Eagle Ford Shale MSAs

housing

Median rent rose in both San Antonio and Laredo from May 2014 to June 2014; it fell in Corpus Christi during the same span.rent_2014_06 Median house prices for San Antonio and Corpus Christi rose from May 2014 to June 2014. Median house prices for Laredo fell from May 2014 to June 2014. house_2014_06Image source: http://www.asemooni.com/news/economic-news/the-president-agreed-with-the-increase-in-housing

Texas hydro-fracturing job openings decreased from May 2014 to June 2014

petroleum engineer The number of job openings in Texas for “petroleum engineers” and “geological and petroleum technicians” decreased from 640 in May 2014 to 622 in June 2014, while the searcher-to-job opening ratio increased from 0.90 to 1.4 in the same span.petro_engineer_2014_06 
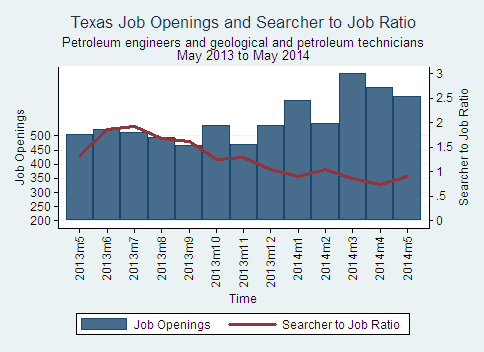
The number of job openings in Texas for “derrick operators” and “roustabouts” decreased from 283 in May 2014 to 270 in June 2014, while the searcher-to-job opening ratio increased from 2.63 to 3.01 in the same span. roustabout_2014_06

Image source: http://wonderfulengineering.com/what-is-petroleum-engineering/.

Texas job openings by major occupational group

Texas June 2014

Total number of job openings and median searcher-to-job ratio across all MSAs (metropolitan statistical areas) for each major occupational group in Texas in May 2014.

Occupation openings s2jratio
Management, business, and financial occupations 54098 0.7
Professional and related occupations 77613 1.19
Office and administrative support occupations 52093 1.2
Installation, maintenance, and repair occupations 16796 1.42
Service occupations 61409 1.65
Sales and related occupations 26907 1.76
Farming, fishing, and forestry occupations 888 2.24
Transportation and material moving occupations 17950 2.28
Production occupations 20146 2.7
Construction and extraction occupations 15616 5.01

Both Crude Oil and Natural Gas Prices Decreased from June 2014 to July 2014

prices_2014_07

Crude oil price decreased from $106.07 per barrel in June 2014 to $98.23 per barrel in July 2014. Natural gas price went down from $4.39 per million BTU (one million BTU is approximately 974 cubic feet) in June 2014 to $3.78 per million BTU in July 2014.

production_2014_05

Texas crude oil production for May 2014 was 66,235,787 barrels, down from 66,731,327 barrels reported in April 2014. Texas natural gas production was 617,988,757 Mcf (thousand cubic feet) of gas in May 2014, up from the April 2014 gas production total of 624,551,008 Mcf.

Job Openings in Texas for Petroleum Engineers, Technicians, and Personnel Decreased from April 2014 to May 2014

petroleum engineerThe number of job openings in Texas for “petroleum engineers” and “geological and petroleum technicians” decreased from 672 in April 2014 to 640 in May 2014, while the searcher-to-job opening ratio increased from 0.74 to 0.90 in the same span.

The number of job openings in Texas for “derrick operators” and “roustabouts” decreased from 294 in April 2014 to 283 in May 2014, while the searcher-to-job opening ratio increased from 2.54 to 2.63 in the same span.

petro_engineer_2014_05roustabout_2014_05


Image source: http://wonderfulengineering.com/what-is-petroleum-engineering/.

Texas Job Openings by Major Occupational Group

Texas May 2014

Total number of job openings and median searcher-to-job ratio across all MSAs (metropolitan statistical areas) for each major occupational group in Texas in May 2014.

occupation openings s2jratio
Management, business, and financial occupations 53053 0.8
Professional and related occupations 77452 0.8
Installation, maintenance, and repair occupations 16964 1.14
Office and administrative support occupations 51305 1.15
Service occupations 61732 1.51
Sales and related occupations 27126 1.79
Transportation and material moving occupations 18312 1.99
Production occupations 20093 2.72
Farming, fishing, and forestry occupations 872 3.61
Construction and extraction occupations 15892 4.46