Using Big Data Analytics in Litigation

Due to the massive computational requirements of analyzing big data, trying to find the best approach to big data projects can be a daunting task for most individuals.  At EmployStats, our team of experts utilize top of the line data systems and software to seamlessly analyze big data and provide our clients with high quality analysis as efficiently as possible.

  1. The general approach for big data analytics begins with fully understanding the data provided as a whole.  Not only must the variable fields in the data be identified, but one must also understand what these variables represent and determine what values are reasonable for each variable in the data set.  
  2. Next, the data must be cleaned and reorganized into the clearest format, ensuring that data values are not missing and are within reasonable ranges of certainty.  As the size of the data increases, the amount of work necessary to clean the data increases.  In larger datasets there are more individual components which are typically dependent on each other, therefore it is necessary to write computer programs to evaluate the accuracy of the data.
  3. Once the entire dataset has been cleaned and properly formatted, one needs to define the question that will be answered with the data.  One must look at the data and see how it relates to the question.  The questions for big data projects may be related to frequencies, probabilities, economic models, or any number of statistical properties.  Whatever it is, one must then process the data in the context of the question at hand.
  4. Once the answer has been obtained, one must determine that the answer is a strong answer.  A delicate answer, or one that would significantly change if the technique of the analysis was altered, is not ideal.  The goal of big data analytics is to have a robust answer, and one must try to attack the same question in a number of different ways in order to build confidence in the answer.

What is Big Data in Litigation?

Big data is not simply a size, it is a way of describing the type of data tools that will be utilized for an analysis.  Most, if not all, of the big data we work with at EmployStats requires specific data tools that are ever changing and evolving, as well as new tools that are being introduced into the market constantly.  

Each avenue will handle big data differently, and offer specific benefits that will determine how an analysis will be performed, as well as how results will be interpreted.  EmployStats constantly keeps up to date with the latest and greatest data analytic software for large data sets in order to optimize the outcome of these types of analyses.  

Many recent cases such as United States of America v. Abbott Laboratories and Pompliano v. Snapchat have utilized big data analysis techniques in litigation, proving that not only is it common to use big data in litigation, it is necessary to bring many cases to a successful close.

Who is David Neumark, Ph.D.?

We are joining forces with David Neumark, Ph.D., an expert on labor market discrimination in California, to bring a new air of expertise to the EmployStats team.  Dr. Neumark is the Chancellor’s Professor of Economics at U.C. Irvine, and has previously taught at Michigan State after starting his career at the Federal Reserve.  His primary work has focused on age and race discrimination, researching into new theories, as well as offering expert consulting for these discrimination cases.  Our highly skilled researchers will be providing support for Dr. Neumark in many of his large, complex employment litigation cases.  We are excited to have him on board!


Employee Update: Susan Wirtanen

EmployStats Research Associate, Susan Wirtanen, recently visited New York, NY to attend a course in Stata.  Stata is a statistical software data analytics tool utilized by EmployStats analysts in almost all of our case work, especially wage and hour, and employment litigation.  The tools Susan learned in attending this training include data management, data manipulation, and tools used for complex analyses.  These skills will allow Susan to work quickly and efficiently through large data sets our clients may provide for analysis.   

Susan Wirtanen was hired at EmployStats in June 2016 as an Intern after graduating from the University of Texas in Austin with a Bachelor’s degree in Economics.  Susan recently began working full-time as a Research Associate at the beginning of 2017.  In addition to being a full-time employee, Susan coaches club volleyball here in Austin, and recently finished her first season of coaching.

Wage and Hour at EmployStats

In late 2016, the US Department of Labor announced a final ruling on overtime, which may go into effect later this year and increase the number of workers eligible for overtime payment.  Here at EmployStats, our specialized team of Research Associates and Economists is fully capable and ready to handle all your wage & hour needs.

At EmployStats, we analyze FLSA and wage & hour violation claims, including time clock rounding, misclassification, off-the-clock work, and missed meal periods.  Our analyses of wage & hour violations typically involve the statistical review of information such as employee time punch records, payroll data, and employee time diary information.  Our goal at EmployStats is to communicate effectively with our clients and fully invest in the project at hand, in order to achieve the best outcomes and form long-lasting professional relationships.  

Our wage & hour clients include plaintiff and defense attorneys, as well as individual employers across the country.  Our wage & hour projects include expert witness trial testimony, expert reports, consultation, and compliance self-audits.  Statistical sampling is used to investigate wage & hour violations in some cases as well.

For more information on how EmployStats can help you with your wage & hour needs, please visit our website at www.employstats.com/wage-and-hour.

Wage & Hour News: The New Overtime Rule

On Wednesday, May 18th, 2016, The Obama Administration announced a significant expansion of who qualifies for overtime pay under federal labor laws. The Department of Labor has issued the Final Rule, which centers primarily on updating the salary and compensation levels needed for executive, administrative and professional workers to be exempt from overtime pay protections.

The Final Rule increases the salary threshold from $23,660 to $47,476, which is the 40th percentile of earnings of full-time salaried workers in the lowest-wage Census Region of the United States. The Department of Labor projects the policy to extend overtime protections to an additional 4.2 million workers, as anyone earning less than the salary threshold is now eligible for overtime payments.

The Final Rule also sets the total annual compensation requirement for highly compensated employees at $134,004, which is the annual equivalent of the 90th percentile of full-time salaried workers in the United States. The Final Rule also amends the salary basis test to allow employers to utilize non-discretionary bonuses and incentive payments to account for up to 10% of the new standard salary level. Lastly,  the ruling establishes a procedure for automatically updating the salary and compensation levels every three years to maintain the levels at the 40th and 90th percentiles of earnings.

The Final Rule will take effect on December 1, 2016, giving employers over six months to prepare and adjust their payment policies. In response, employers will have the options to pay time-and-a-half for overtime work, raise workers’ salaries above the new salary threshold, limit workers’ hours to 40 hours per week, or a combination of the above.

For more information on the new overtime ruling, please visit http://www.dol.gov/featured/overtime.

Video from the Department of Labor:

https://youtu.be/UFJaDm720FU


Employment and Wage & Hour Statistics Focus: Occupational Employment Statistics

The Occupational Employment Statistics (OES) program, conducted by the Bureau of Labor Statistics (BLS), provides employment and wage information by occupation and geographic location. Hourly and annual mean and median wages are available for more than 800 different occupations at the national, regional, state, and MSA level.

According to the latest OES news release, the healthcare industry employed 12 million people in May 2015, which represents nearly 9% of the nation’s total employment. Registered nurses (2.7 million), nursing assistants (1.4 million), and home health aides (820,630) were the largest healthcare occupations.

For more information, please refer to www.bls.gov/oes


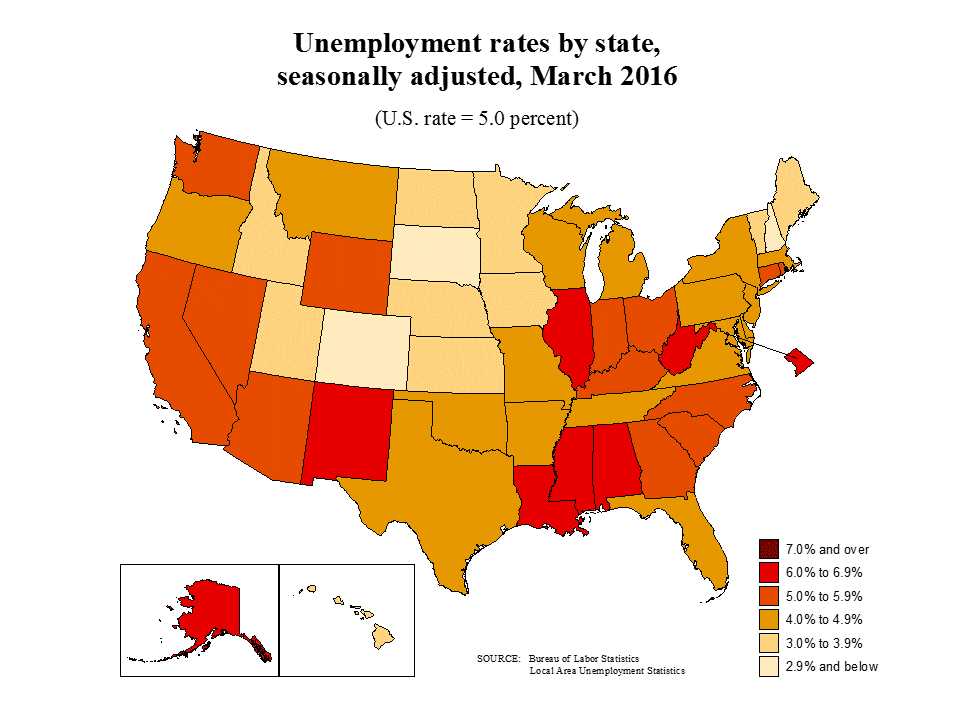
Employment and Wage & Hour Statistics Focus: Local Area Unemployment Statistics

Local Area Unemployment Statistics (LAUS) is made available by the Bureau of Labor Statistics (BLS), and offers monthly data on employment and unemployment for approximately 7,500 geographic areas. Unemployment rates are available monthly by county, MSA, and state level.

These estimates are key indicators of local economic conditions, and may be compared over time to examine changes in the labor market.

For more information regarding the LAUS, please refer to www.bls.gov/lau

Employment and Wage & Hour Statistics Focus: Job Openings and Labor Turnover Survey

The Job Openings and Labor Turnover Survey  (JOLTS) is a monthly survey conducted by the Bureau of Labor Statistics. JOLTS collects data on total employment, the number of job openings, the number of hires, and the number of separations including quits and layoffs. JOLTS can be used to measure the growth of a particular industry and to better understand labor-market opportunities.

According to the latest release on April 5th, 2016, job hires in the United States increased to 5.4 million in February 2016, while during this same period separations made little change at 5.1 million.

For more information on the JOLTS, please refer to www.bls.gov/jlt


Employment and Wage & Hour Statistics Focus: Equal Employment Opportunity Census

The Equal Employment Opportunity (EEO) Census is a tabulation created every ten years for the purpose of serving as an external benchmark for comparing the composition of a company’s workforce to that of the external labor market within a specific geographic area and job category. The EEO Census provides worker counts based on race, ethnicity, gender, age, education level, industry, occupation, and geography. While the raw data is not readily available, 24 tables provide counts for varying cuts of the data.

The EEO Census is most often seen in Affirmative Action Plans and EEO Commission compliance reviews. It is also useful in the litigation setting companies when there are allegations of discrimination.

For more information, please refer to: www.census.gov/hhes/www/eeoindex/eeoindex.html