Local Area Unemployment Statistics (LAUS) is made available by the Bureau of Labor Statistics (BLS), and offers monthly data on employment and unemployment for approximately 7,500 geographic areas. Unemployment rates are available monthly by county, MSA, and state level.

These estimates are key indicators of local economic conditions, and may be compared over time to examine changes in the labor market.

For more information regarding the LAUS, please refer to www.bls.gov/lau

The number of job openings in California decreased from 625,696 in August 2015 to 615,711 in September 2015. The median number of job searchers per job opening across all Metropolitan Statistical Areas (MSAs) and occupations in California also decreased from 1.47 in August 2015 to 1.27 in September 2015.


CA_2015_09
Source: BLS

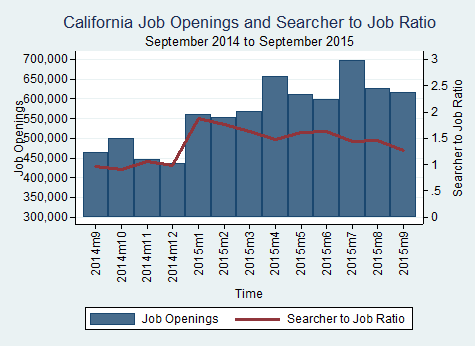
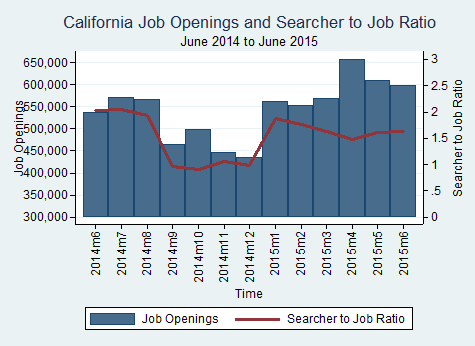
All 4 of the largest Metropolitan Statistical Areas (MSAs) in California experienced a decrease in job openings for the month of August.

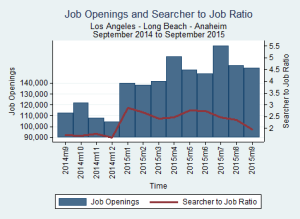
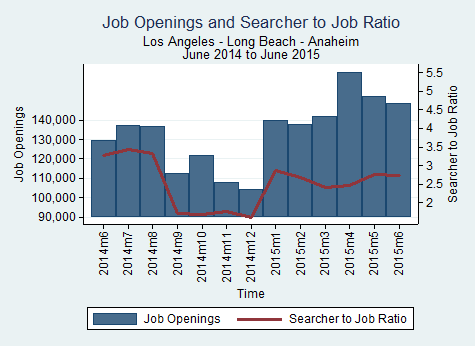
Los Angeles – Long Beach – Santa Ana

The Los Angeles-Long Beach-Santa Ana MSA experienced a decrease of 18,134 job openings in August 2015, a -10.4% change from July 2015.

Month Total Openings Percent Monthly Change
Sep-14 112,657 -17.73
Oct-14 121,598 7.94
Nov-14 108,123 -11.08
Dec-14 104,302 -3.53
Jan-15 140,013 34.24
Feb-15 137,967 -1.46
Mar-15 141,983 2.91
Apr-15 164,525 15.88
May-15 152,008 -7.61
Jun-15 148,658 -2.2
Jul-15 174,288 17.24
Aug-15 156,154 -10.4


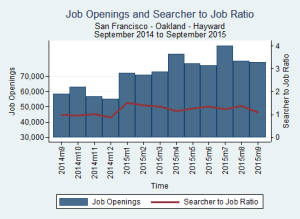
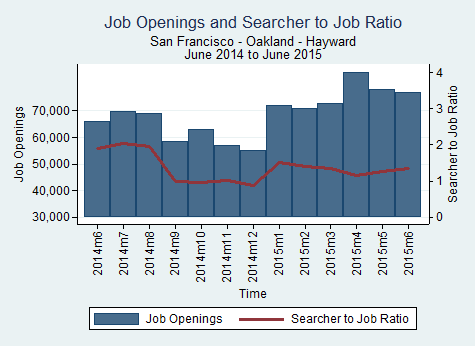
San Francisco – Oakland – Freemont

The San Francisco-Oakland-Fremont MSA experienced a decrease of 9,854 job openings in August 2015, a -10.95% change from July 2015.

Month Total Openings Percent Monthly Change
Sep-14 58,567 -15.38
Oct-14 63,065 7.68
Nov-14 56,940 -9.71
Dec-14 54,986 -3.43
Jan-15 72,089 31.11
Feb-15 70,884 -1.67
Mar-15 72,887 2.83
Apr-15 84,472 15.89
May-15 78,232 -7.39
Jun-15 77,039 -1.52
Jul-15 89,946 16.75
Aug-15 80,092 -10.95

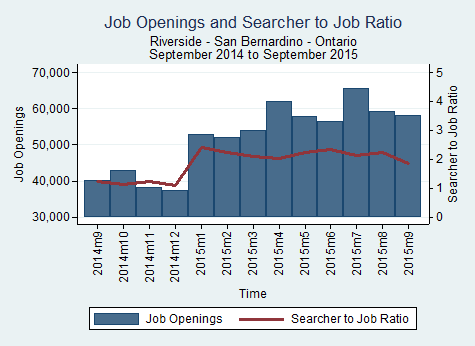
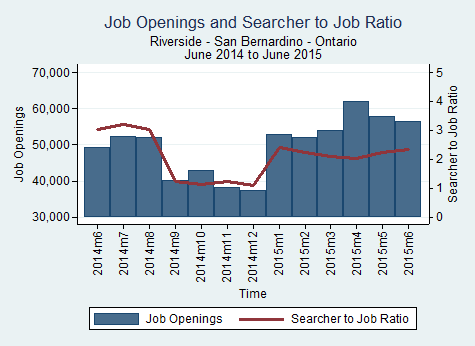
Riverside – San Bernardino – Ontario

The Riverside-San Bernardino-Ontario MSA experienced a decrease of 6,442 job openings in August 2015, a -9.82% change from July 2015.

Month Total Openings Percent Monthly Change
Sep-14 40,018 -22.93
Oct-14 42,870 7.13
Nov-14 38,138 -11.04
Dec-14 37,377 -2
Jan-15 52,811 41.29
Feb-15 52,141 -1.27
Mar-15 53,849 3.27
Apr-15 62,004 15.15
May-15 57,837 -6.72
Jun-15 56,343 -2.58
Jul-15 65,608 16.44
Aug-15 59,166 -9.82

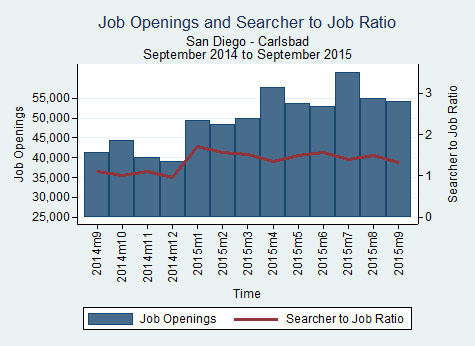
San Diego – Carlsbad – San Marcos

The San Diego-Carlsbad-San Marcos MSA experienced a decrease of 6,576 job openings in August 2015, a -10.7% change from July 2015.

Month Total Openings Percent Monthly Change
Sep-14 41,343 -15.64
Oct-14 44,408 7.41
Nov-14 39,956 -10.02
Dec-14 38,937 -2.55
Jan-15 49,272 26.54
Feb-15 48,492 -1.58
Mar-15 49,955 3.02
Apr-15 57,749 15.6
May-15 53,722 -6.97
Jun-15 52,803 -1.71
Jul-15 61,473 16.42
Aug-15 54,897 -10.7


Source: BLS

All four of the largest Metropolitan Statistical Areas (MSAs) in Texas experienced a decrease in job openings from July 2015 to August 2015.

Dallas

Dallas experienced a decrease of 12,075 job openings from July 2015 to August 2015, a 10.54% decrease.

Date Total Openings Monthly Change Yearly Change
Aug-15 102,497 -10.54% 43.49%
Jul-15 114,572 16.84% 27.63%
Jun-15 98,055 -1.64% 8.25%
May-15 99,685 -6.84% 17.59%
Apr-15 107,005 15.49% 26.59%
Mar-15 92,653 2.87% 3.43%
Feb-15 90,072 -1.85% 23.93%
Jan-15 91,770 38.18% 29.39%
Dec-14 66,413 -4.20% -11.31%
Nov-14 69,326 -10.74% 11.28%
Oct-14 77,670 8.74% 19.49%
Sep-14 71,430 -20.43% -6.57%

Austin

Austin experienced a decrease of 5,002 job openings from July 2015 to August 2015, a 10.34% decrease.

Date Total Openings Monthly Change Yearly Change
Aug-15 43,395 -10.34% 34.13%
Jul-15 48,397 15.94% 26.28%
Jun-15 41,742 -1.41% 7.20%
May-15 42,340 -6.27% 15.22%
Apr-15 45,170 14.25% 24.68%
Mar-15 39,536 3.03% 4.12%
Feb-15 38,372 -1.78% 23.78%
Jan-15 39,066 26.19% 28.32%
Dec-14 30,957 -1.84% -2.14%
Nov-14 31,539 -9.03% 18.96%
Oct-14 34,670 7.17% 24.53%
Sep-14 32,352 -15.59% -0.45%

Houston

Houston experienced a decrease of 10,761 job openings from July 2015 to August 2015, a decrease of 10.58%.

Date Total Openings Monthly Change Yearly Change
Aug-15 90,902 -10.58% 42.04%
Jul-15 101,663 15.95% 26.61%
Jun-15 87,680 -1.05% 7.20%
May-15 88,612 -6.05% 17.32%
Apr-15 94,317 14.01% 24.76%
Mar-15 82,726 3.76% 3.78%
Feb-15 79,730 -2.12% 20.96%
Jan-15 81,454 35.88% 28.02%
Dec-14 59,945 -3.04% -10.92%
Nov-14 61,824 -11.15% 10.35%
Oct-14 69,582 8.73% 19.68%
Sep-14 63,998 -20.30% -5.99%

San Antonio

San Antonio has experienced a decrease of 4,229 job openings from July 2015 to August 2015, a decrease of 9.5%.

Date Total Openings Monthly Change Yearly Change
Aug-15 40,261 -9.50% 39.77%
Jul-15 44,490 16.80% 22.88%
Jun-15 38,089 -2.36% 5.32%
May-15 39,009 -7.10% 14.34%
Apr-15 41,990 15.00% 23.40%
Mar-15 36,512 2.73% 1.38%
Feb-15 35,543 -1.08% 22.30%
Jan-15 35,932 34.70% 26.88%
Dec-14 26,676 -3.61% -10.95%
Nov-14 27,676 -11.80% 12.69%
Oct-14 31,377 8.93% 21.21%
Sep-14 28,805 -20.44% -4.98%


Source: BLS

STEM logo

The number of job openings in Texas for STEM (science, technology, engineering, math) jobs increased from 48,441 in June to 56,433 in July 2015. The searcher-to-job opening ratio decreased from 1.73 to 1.67 in the same span.

Our definition of STEM jobs: http://www.employstats.com/blog/2014/09/19/growing-national-interest-in-stem-fields-has-focused-our-research/

STEM_2015_07

Source: BLS

Image source: http://projecttomorrowblog.blogspot.com/2013/11/i-am-scientist.html

The top three occupations with the most new job openings in Texas for the month of July were Driver/Sales Workers and Truck Drivers with 1,084 new openings, Managers with 1,061 new openings, and Cashiers with 1,145 new openings.

July 2015

Occupation Total Openings New Openings
Driver/Sales Workers and Truck Drivers 7,552 1,084
Managers 7,951 1,061
Cashiers 7,149 1,145

Source: BLS

The number of job openings in California decreased from 610,591 in May 2015 to 598,171 in June 2015. The median number of job searchers per job opening across all Metropolitan Statistical Areas (MSAs) and occupations in California increased from 1.62 in May 2015 to 1.63 in June 2015.

CA_2015_06


Source: BLS

All four largest MSAs (metropolitan statistical areas) in Texas experienced a decrease in job openings from May 2015 to June 2015.

Dallas

Dallas experienced a decrease of 1,630 job openings from May 2015 to June 2015, a 1.64% decrease.

Date Total Openings Monthly Change Yearly Change
June 2015 98,055 -1.64% 8.25%
May 2015 99,685 -7.56% 17.59%
April 2015 107,841 16.39% 27.58%
March 2015 92,653 2.87% 3.43%
February 2015 90,072 -1.85% 23.93%
January 2015 91,770 38.18% 29.39%
December 2014 66,413 -4.20% -11.31%
November 2014 69,326 -10.74% 11.28%
October 2014 77,670 8.74% 19.49%
September 2014 71,430 -20.43% -6.57%
August 2014 89,770 -0.90% 27.29%
July 2014 90,586 6.86% 28.67%

Austin

Austin experienced a decrease of 598 job openings from May 2015 to June 2015, a 1.41% decrease.

Date Total Openings Monthly Change Yearly Change
June 2015 41,742 -1.41% 7.20%
May 2015 42,340 -6.97% 15.22%
April 2015 45,514 15.12% 25.63%
March 2015 39,536 3.03% 4.12%
February 2015 38,372 -1.78% 23.78%
January 2015 39,066 26.19% 28.32%
December 2014 30,957 -1.84% -2.14%
November 2014 31,539 -9.03% 18.96%
October 2014 34,670 7.17% 24.53%
September 2014 32,352 -15.59% -0.45%
August 2014 38,327 -1.57% 28.78%
July 2014 38,938 5.96% 28.50%

Houston

Houston experienced a decrease of 932 job openings from May 2015 to June 2015, a 1.05% decrease.

Date Total Openings Monthly Change Yearly Change
June 2015 87,680 -1.05% 7.20%
May 2015 88,612 -7.15% 17.32%
April 2015 95,434 15.36% 26.24%
March 2015 82,726 3.76% 3.78%
February 2015 79,730 -2.12% 20.96%
January 2015 81,454 35.88% 28.02%
December 2014 59,945 -3.04% -10.92%
November 2014 61,824 -11.15% 10.35%
October 2014 69,582 8.73% 19.68%
September 2014 63,998 -20.30% -5.99%
August 2014 80,299 -1.83% 27.86%
July 2014 81,792 8.29% 29.66%

San Antonio

San Antonio experienced a decrease of 920 job openings from May 2015 to June 2015, a 2.36% decrease.

Date Total Openings Monthly Change Yearly Change
June 2015 38,089 -2.36% 5.32%
May 2015 39,009 -8.05% 14.34%
April 2015 42,425 16.19% 24.67%
March 2015 36,512 2.73% 1.38%
February 2015 35,543 -1.08% 22.30%
January 2015 35,932 34.70% 26.88%
December 2014 26,676 -3.61% -10.95%
November 2014 27,676 -11.80% 12.69%
October 2014 31,377 8.93% 21.21%
September 2014 28,805 -20.44% -4.98%
August 2014 36,207 0.12% 27.65%
July 2014 36,164 6.00% 27.85%


Source: BLS