All 4 of the largest MSAs (metropolitan statistical areas) in California experienced a decrease in job openings for the month of June.

Los Angeles-Long Beach-Anaheim

The Los Angeles-Long Beach-Anaheim MSA experienced a decrease of 3,350 job openings in June 2015, a 2.20% change from May 2015.

Month Total Openings Percent Monthly Change
July 2014 137,333 5.82
August 2014 136,939 -0.29
September 2014 112,657 -17.73
October 2014 121,598 7.94
November 2014 108,123 -11.08
December 2014 104,302 -3.53
January 2015 140,013 34.24
February 2015 137,967 -1.46
March 2015 141,983 2.91
April 2015 164,525 15.88
May 2015 152,008 -7.61
June 2015 148,658 -2.20

San Francisco-Oakland-Fremont

The San Francisco-Oakland-Fremont MSA experienced a decrease of 1,193 job openings in June 2015, an 1.52% change from May 2015.

Month Total Openings Percent Monthly Change
July 2014 69,790 5.4
August 2014 69,209 -0.83
September 2014 58,567 -15.38
October 2014 63,065 7.68
November 2014 56,940 -9.71
December 2014 54,986 -3.43
January 2015 72,089 31.11
February 2015 70,884 -1.67
March 2015 72,887 2.83
April 2015 84,472 15.89
May 2015 78,232 -7.39
June 2015 77,039 -1.52


Riverside-San Bernardino-Ontario

The Riverside-San Bernardino-Ontario MSA experienced a decrease of 1,494 job openings in June 2015, an 2.58% change from May 2015.

Month Total Openings Percent Monthly Change
July 2014 52,360 6.55
August 2014 51,924 -0.83
September 2014 40,018 -22.93
October 2014 42,870 7.13
November 2014 38,138 -11.04
December 2014 37,377 -2.00
January 2015 52,811 41.29
February 2015 52,141 -1.27
March 2015 53,849 3.27
April 2015 62,004 15.15
May 2015 57,837 -6.72
June 2015 56,343 -2.58

San Diego-Carlsbad-San Marcos

The San Diego-Carlsbad-San Marcos MSA experienced a decrease of 919 job openings in June 2015, an 1.71% change from May 2015.

Month Total Openings Percent Monthly Change
July 2014 49,258 5.52
August 2014 49,007 -0.51
September 2014 41,343 -15.64
October 2014 44,408 7.41
November 2014 39,956 -10.02
December 2014 38,937 -2.55
January 2015 49,272 26.54
February 2015 48,492 -1.58
March 2015 49,955 3.02
April 2015 57,749 15.6
May 2015 53,722 -6.97
June 2015 52,803 -1.71


Source: BLS

petroleum engineer
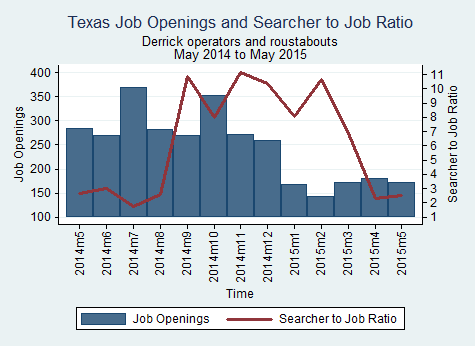
The number of job openings in Texas for “petroleum engineers” and “geological and petroleum technicians” decreased from 661 in April 2015 to 639 in May 2015, while the searcher-to-job opening ratio increased from 1.97 to 2.16 in the same span.

petro_engineer_2015_05

The number of job openings in Texas for “derrick operators” and “roustabouts” decreased from 181 in April 2015 to 171 in May 2015, while the searcher-to-job opening ratio increased from 2.29 to 2.54 in the same span.

roustabout_2015_05

Source: BLS

Image source: http://wonderfulengineering.com/what-is-petroleum-engineering/

Total number of job openings and median searcher-to-job ratio across all MSAs (metropolitan statistical areas) for each major occupational group in Texas in May 2015.

Texas May 2015

Occupation Openings Searcher to Job Ratio
Transportation and material moving occupations 21,863 0.5
Installation, maintenance, and repair occupations 18,972 0.52
Sales and related occupations 32,760 0.72
Office and administrative support occupations 59,401 0.79
Farming, fishing, and forestry occupations 1,109 0.89
Management, business, and financial occupations 60,970 0.91
Service occupations 69,934 1.17
Production occupations 23,088 1.39
Professional and related occupations 89,387 1.46
Construction and extraction occupations 16,079 1.47

The number of job openings in California decreased from 657,459 in April 2015 to 610,591 in May 2015. The median number of job searchers per job opening across all MSAs (metropolitan statistical areas) and occupations in California increased from 1.48 in April 2015 to 1.62 in May 2015.

CA_2015_05
Source: BLS

The number of job openings in Texas decreased from 424,525 in April 2015 to 393,563 in May 2015. The median number of job searchers per job opening across all MSAs (metropolitan statistical areas) and occupations in Texas increased from 0.93 in April 2015 to 1.04 in May 2015.

tx_2015_05

Source: BLS

All four largest MSAs (metropolitan statistical areas) in Texas experienced a decrease in job openings from April 2015 to May 2015.

Dallas

Dallas experienced a decrease of 8,156 job openings from April 2015 to May 2015, a 7.56% decrease.

Date Total Openings Monthly Change Yearly Change
May-15 99,685 -7.56% 17.59%
Apr-15 107,841 16.39% 27.58%
Mar-15 92,653 2.87% 3.43%
Feb-15 90,072 -1.85% 23.93%
Jan-15 91,770 38.18% 29.39%
Dec-14 66,413 -4.20% -11.31%
Nov-14 69,326 -10.74% 11.28%
Oct-14 77,670 8.74% 19.49%
Sep-14 71,430 -20.43% -6.57%
Aug-14 89,770 -0.90% 27.29%
Jul-14 90,586 6.86% 28.67%
Jun-14 84,771 0.29% 15.23%

Austin

Austin experienced a decrease of 3,174 job openings from April 2015 to May 2015, a 6.97% decrease.

Date Total Openings Monthly Change Yearly Change
May-15 42,340 -6.97% 15.22%
Apr-15 45,514 15.12% 25.63%
Mar-15 39,536 3.03% 4.12%
Feb-15 38,372 -1.78% 23.78%
Jan-15 39,066 26.19% 28.32%
Dec-14 30,957 -1.84% -2.14%
Nov-14 31,539 -9.03% 18.96%
Oct-14 34,670 7.17% 24.53%
Sep-14 32,352 -15.59% -0.45%
Aug-14 38,327 -1.57% 28.78%
Jul-14 38,938 5.96% 28.50%
Jun-14 36,748 1.44% 15.98%

Houston

Houston experienced a decrease of 6,822 job openings from April 2015 to May 2015, a 7.15% decrease.

Date Total Openings Monthly Change Yearly Change
May-15 88,612 -7.15% 17.32%
Apr-15 95,434 15.36% 26.24%
Mar-15 82,726 3.76% 3.78%
Feb-15 79,730 -2.12% 20.96%
Jan-15 81,454 35.88% 28.02%
Dec-14 59,945 -3.04% -10.92%
Nov-14 61,824 -11.15% 10.35%
Oct-14 69,582 8.73% 19.68%
Sep-14 63,998 -20.30% -5.99%
Aug-14 80,299 -1.83% 27.86%
Jul-14 81,792 8.29% 29.66%
Jun-14 75,527 -0.09% 14.68%

San Antonio

San Antonio experienced a decrease of 3,416 job openings from April 2015 to May 2015, a 8.05% decrease.

Date Total Openings Monthly Change Yearly Change
May-15 39,009 -8.05% 14.34%
Apr-15 42,425 16.19% 24.67%
Mar-15 36,512 2.73% 1.38%
Feb-15 35,543 -1.08% 22.30%
Jan-15 35,932 34.70% 26.88%
Dec-14 26,676 -3.61% -10.95%
Nov-14 27,676 -11.80% 12.69%
Oct-14 31,377 8.93% 21.21%
Sep-14 28,805 -20.44% -4.98%
Aug-14 36,207 0.12% 27.65%
Jul-14 36,164 6.00% 27.85%
Jun-14 34,117 0.26% 15.48%

Source: BLS

All 4 of the largest MSAs (metropolitan statistical areas) in California experienced a decrease in job openings for the month of May.

Los Angeles-Long Beach-Anaheim

The Los Angeles-Long Beach-Anaheim MSA experienced a decrease of 12,517 job openings in May 2015, a 7.61% change from April 2015.

Month Total Openings Percent Monthly Change
Jun-14 129,782 0.19
Jul-14 137,333 5.82
Aug-14 136,939 -0.29
Sep-14 112,657 -17.73
Oct-14 121,598 7.94
Nov-14 108,123 -11.08
Dec-14 104,302 -3.53
Jan-15 140,013 34.24
Feb-15 137,967 -1.46
Mar-15 141,983 2.91
Apr-15 164,525 15.88
May-15 152,008 -7.61

San Francisco-Oakland-Fremont

The San Francisco-Oakland-Fremont MSA experienced a decrease of 6,240 job openings in May 2015, an 7.39% change from April 2015.

Month Total Openings Percent Monthly Change
Jun-14 66,213 0.65
Jul-14 69,790 5.4
Aug-14 69,209 -0.83
Sep-14 58,567 -15.38
Oct-14 63,065 7.68
Nov-14 56,940 -9.71
Dec-14 54,986 -3.43
Jan-15 72,089 31.11
Feb-15 70,884 -1.67
Mar-15 72,887 2.83
Apr-15 84,472 15.89
May-15 78,232 -7.39

Riverside-San Bernardino-Ontario
The Riverside-San Bernardino-Ontario MSA experienced a decrease of 4,167 job openings in May 2015, an 6.72% change from April 2015.

Month Total Openings Percent Monthly Change
Jun-14 49,141 0.42
Jul-14 52,360 6.55
Aug-14 51,924 -0.83
Sep-14 40,018 -22.93
Oct-14 42,870 7.13
Nov-14 38,138 -11.04
Dec-14 37,377 -2.00
Jan-15 52,811 41.29
Feb-15 52,141 -1.27
Mar-15 53,849 3.27
Apr-15 62,004 15.15
May-15 57,837 -6.72

San Diego-Carlsbad-San Marcos

The San Diego-Carlsbad-San Marcos MSA experienced a decrease of 4,027 job openings in May 2015, an 6.97% change from April 2015.

Month Total Openings Percent Monthly Change
Jun-14 46,681 0.71
Jul-14 49,258 5.52
Aug-14 49,007 -0.51
Sep-14 41,343 -15.64
Oct-14 44,408 7.41
Nov-14 39,956 -10.02
Dec-14 38,937 -2.55
Jan-15 49,272 26.54
Feb-15 48,492 -1.58
Mar-15 49,955 3.02
Apr-15 57,749 15.6
May-15 53,722 -6.97

Source: BLS

healthcare

The number of job openings in California for nurses, therapists, and physician assistants decreased from 20,399 in April 2015 to 18,450 in May 2015. The searcher-to-job opening ratio increased from 2.16 to 2.39 in the same span.

nurse_2015_05


Source: BLS

Image source: http://pediatric-nurse-practitioners.blogspot.com/2012/12/top-5-cardiac-care-nursing-jobs-for-we.html