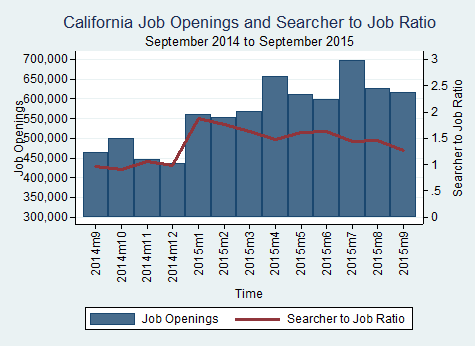
Compared to September of last year, all of the main Metropolitan Statistical Areas (MSAs) in California saw an annual increase in the number of job openings and an increase in the searcher-to-job opening ratio.
Source: BLS
Compared to September of last year, all of the main Metropolitan Statistical Areas (MSAs) in California saw an annual increase in the number of job openings and an increase in the searcher-to-job opening ratio.
Source: BLS
The number of job openings in California decreased from 625,696 in August 2015 to 615,711 in September 2015. The median number of job searchers per job opening across all Metropolitan Statistical Areas (MSAs) and occupations in California also decreased from 1.47 in August 2015 to 1.27 in September 2015.
Source: BLS
All 4 of the largest Metropolitan Statistical Areas (MSAs) in California experienced a decrease in job openings for the month of August.
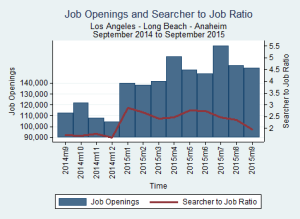
Los Angeles – Long Beach – Santa Ana
The Los Angeles-Long Beach-Santa Ana MSA experienced a decrease of 18,134 job openings in August 2015, a -10.4% change from July 2015.
| Month | Total Openings | Percent Monthly Change | |
| Sep-14 | 112,657 | -17.73 | |
| Oct-14 | 121,598 | 7.94 | |
| Nov-14 | 108,123 | -11.08 | |
| Dec-14 | 104,302 | -3.53 | |
| Jan-15 | 140,013 | 34.24 | |
| Feb-15 | 137,967 | -1.46 | |
| Mar-15 | 141,983 | 2.91 | |
| Apr-15 | 164,525 | 15.88 | |
| May-15 | 152,008 | -7.61 | |
| Jun-15 | 148,658 | -2.2 | |
| Jul-15 | 174,288 | 17.24 | |
| Aug-15 | 156,154 | -10.4 |
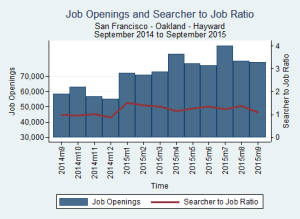
San Francisco – Oakland – Freemont
The San Francisco-Oakland-Fremont MSA experienced a decrease of 9,854 job openings in August 2015, a -10.95% change from July 2015.
| Month | Total Openings | Percent Monthly Change | |
| Sep-14 | 58,567 | -15.38 | |
| Oct-14 | 63,065 | 7.68 | |
| Nov-14 | 56,940 | -9.71 | |
| Dec-14 | 54,986 | -3.43 | |
| Jan-15 | 72,089 | 31.11 | |
| Feb-15 | 70,884 | -1.67 | |
| Mar-15 | 72,887 | 2.83 | |
| Apr-15 | 84,472 | 15.89 | |
| May-15 | 78,232 | -7.39 | |
| Jun-15 | 77,039 | -1.52 | |
| Jul-15 | 89,946 | 16.75 | |
| Aug-15 | 80,092 | -10.95 |
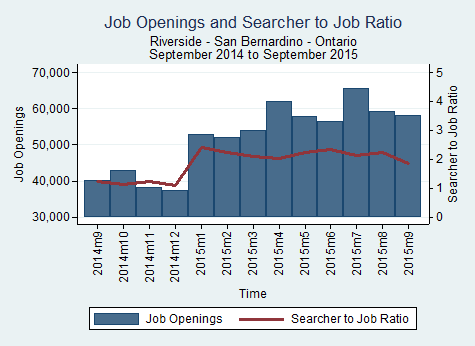
Riverside – San Bernardino – Ontario
The Riverside-San Bernardino-Ontario MSA experienced a decrease of 6,442 job openings in August 2015, a -9.82% change from July 2015.
| Month | Total Openings | Percent Monthly Change |
| Sep-14 | 40,018 | -22.93 |
| Oct-14 | 42,870 | 7.13 |
| Nov-14 | 38,138 | -11.04 |
| Dec-14 | 37,377 | -2 |
| Jan-15 | 52,811 | 41.29 |
| Feb-15 | 52,141 | -1.27 |
| Mar-15 | 53,849 | 3.27 |
| Apr-15 | 62,004 | 15.15 |
| May-15 | 57,837 | -6.72 |
| Jun-15 | 56,343 | -2.58 |
| Jul-15 | 65,608 | 16.44 |
| Aug-15 | 59,166 | -9.82 |
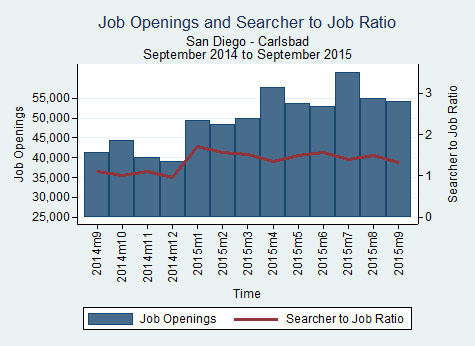
San Diego – Carlsbad – San Marcos
The San Diego-Carlsbad-San Marcos MSA experienced a decrease of 6,576 job openings in August 2015, a -10.7% change from July 2015.
| Month | Total Openings | Percent Monthly Change |
| Sep-14 | 41,343 | -15.64 |
| Oct-14 | 44,408 | 7.41 |
| Nov-14 | 39,956 | -10.02 |
| Dec-14 | 38,937 | -2.55 |
| Jan-15 | 49,272 | 26.54 |
| Feb-15 | 48,492 | -1.58 |
| Mar-15 | 49,955 | 3.02 |
| Apr-15 | 57,749 | 15.6 |
| May-15 | 53,722 | -6.97 |
| Jun-15 | 52,803 | -1.71 |
| Jul-15 | 61,473 | 16.42 |
| Aug-15 | 54,897 | -10.7 |
Source: BLS
California experienced an increase of 198 innovation job openings from August 2015 to September 2015, an increase of 0.72%. Texas experienced an increase of 96 innovation job openings from August 2015 to September 2015, an increase of 0.65%.

| State | Total Openings | Monthly Change | Yearly Change |
| CA | 27,692 | 0.72% | 7.85% |
| TX | 14,906 | 0.65% | 9.86% |
Innovation jobs definition: http://www.employstats.com/blog/2014/09/26/1233/
Source: BLS
Image source: http://www.bizjournals.com/sacramento/news/2013/09/23/symposium-innovation-ecosystems-jobs-wea.html
California experienced a decrease of 549 innovation job openings from May 2015 to June 2015, a decrease of 0.69%. Texas experienced an increase of 79 innovation job openings from May 2015 to June 2015, an increase of 0.16%.
Our definition of STEM jobs: http://www.employstats.com/blog/2014/09/19/growing-national-interest-in-stem-fields-has-focused-our-research/
![]()
| State | Total Openings | Monthly Change | Yearly Change |
| CA | 79,402 | -0.69% | 8.76% |
| TX | 48,441 | 0.16% | 9.83% |
Source: BLS
Image source: http://projecttomorrowblog.blogspot.com/2013/11/i-am-scientist.html
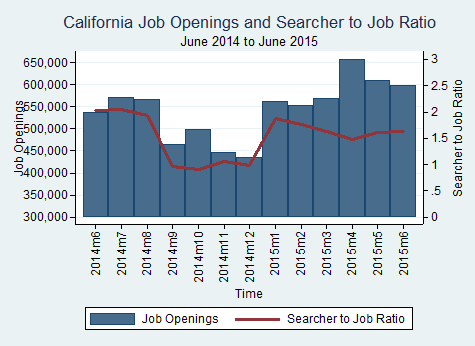
Compared to June of last year, all of the main Metropolitan Statistical Areas (MSAs) in California saw an annual increase in the number of job openings and decrease in the searcher-to-job opening ratio.

Source: BLS
All 4 of the largest MSAs (metropolitan statistical areas) in California experienced a decrease in job openings for the month of June.
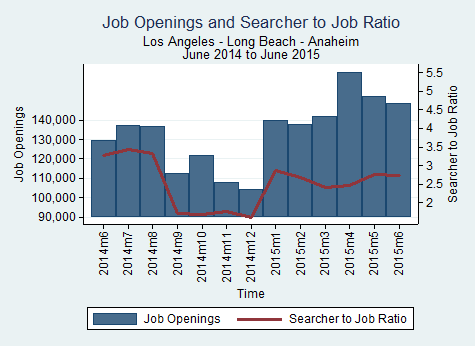
Los Angeles-Long Beach-Anaheim
The Los Angeles-Long Beach-Anaheim MSA experienced a decrease of 3,350 job openings in June 2015, a 2.20% change from May 2015.
| Month | Total Openings | Percent Monthly Change |
| July 2014 | 137,333 | 5.82 |
| August 2014 | 136,939 | -0.29 |
| September 2014 | 112,657 | -17.73 |
| October 2014 | 121,598 | 7.94 |
| November 2014 | 108,123 | -11.08 |
| December 2014 | 104,302 | -3.53 |
| January 2015 | 140,013 | 34.24 |
| February 2015 | 137,967 | -1.46 |
| March 2015 | 141,983 | 2.91 |
| April 2015 | 164,525 | 15.88 |
| May 2015 | 152,008 | -7.61 |
| June 2015 | 148,658 | -2.20 |
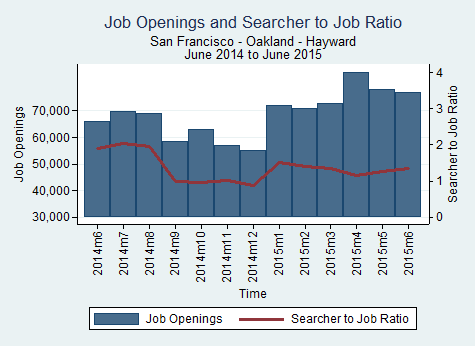
San Francisco-Oakland-Fremont
The San Francisco-Oakland-Fremont MSA experienced a decrease of 1,193 job openings in June 2015, an 1.52% change from May 2015.
| Month | Total Openings | Percent Monthly Change |
| July 2014 | 69,790 | 5.4 |
| August 2014 | 69,209 | -0.83 |
| September 2014 | 58,567 | -15.38 |
| October 2014 | 63,065 | 7.68 |
| November 2014 | 56,940 | -9.71 |
| December 2014 | 54,986 | -3.43 |
| January 2015 | 72,089 | 31.11 |
| February 2015 | 70,884 | -1.67 |
| March 2015 | 72,887 | 2.83 |
| April 2015 | 84,472 | 15.89 |
| May 2015 | 78,232 | -7.39 |
| June 2015 | 77,039 | -1.52 |
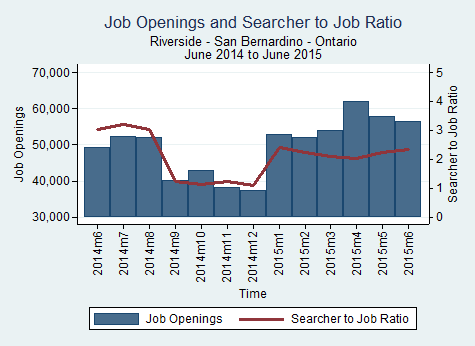
Riverside-San Bernardino-Ontario
The Riverside-San Bernardino-Ontario MSA experienced a decrease of 1,494 job openings in June 2015, an 2.58% change from May 2015.
| Month | Total Openings | Percent Monthly Change |
| July 2014 | 52,360 | 6.55 |
| August 2014 | 51,924 | -0.83 |
| September 2014 | 40,018 | -22.93 |
| October 2014 | 42,870 | 7.13 |
| November 2014 | 38,138 | -11.04 |
| December 2014 | 37,377 | -2.00 |
| January 2015 | 52,811 | 41.29 |
| February 2015 | 52,141 | -1.27 |
| March 2015 | 53,849 | 3.27 |
| April 2015 | 62,004 | 15.15 |
| May 2015 | 57,837 | -6.72 |
| June 2015 | 56,343 | -2.58 |
San Diego-Carlsbad-San Marcos
The San Diego-Carlsbad-San Marcos MSA experienced a decrease of 919 job openings in June 2015, an 1.71% change from May 2015.
| Month | Total Openings | Percent Monthly Change |
| July 2014 | 49,258 | 5.52 |
| August 2014 | 49,007 | -0.51 |
| September 2014 | 41,343 | -15.64 |
| October 2014 | 44,408 | 7.41 |
| November 2014 | 39,956 | -10.02 |
| December 2014 | 38,937 | -2.55 |
| January 2015 | 49,272 | 26.54 |
| February 2015 | 48,492 | -1.58 |
| March 2015 | 49,955 | 3.02 |
| April 2015 | 57,749 | 15.6 |
| May 2015 | 53,722 | -6.97 |
| June 2015 | 52,803 | -1.71 |
Source: BLS
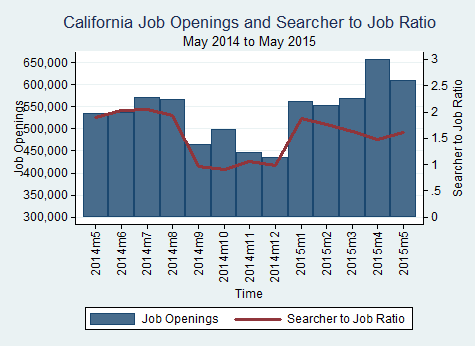
All 4 of the largest MSAs (metropolitan statistical areas) in California experienced a decrease in job openings for the month of May.
Los Angeles-Long Beach-Anaheim
The Los Angeles-Long Beach-Anaheim MSA experienced a decrease of 12,517 job openings in May 2015, a 7.61% change from April 2015.
| Month | Total Openings | Percent Monthly Change |
| Jun-14 | 129,782 | 0.19 |
| Jul-14 | 137,333 | 5.82 |
| Aug-14 | 136,939 | -0.29 |
| Sep-14 | 112,657 | -17.73 |
| Oct-14 | 121,598 | 7.94 |
| Nov-14 | 108,123 | -11.08 |
| Dec-14 | 104,302 | -3.53 |
| Jan-15 | 140,013 | 34.24 |
| Feb-15 | 137,967 | -1.46 |
| Mar-15 | 141,983 | 2.91 |
| Apr-15 | 164,525 | 15.88 |
| May-15 | 152,008 | -7.61 |
San Francisco-Oakland-Fremont
The San Francisco-Oakland-Fremont MSA experienced a decrease of 6,240 job openings in May 2015, an 7.39% change from April 2015.
| Month | Total Openings | Percent Monthly Change |
| Jun-14 | 66,213 | 0.65 |
| Jul-14 | 69,790 | 5.4 |
| Aug-14 | 69,209 | -0.83 |
| Sep-14 | 58,567 | -15.38 |
| Oct-14 | 63,065 | 7.68 |
| Nov-14 | 56,940 | -9.71 |
| Dec-14 | 54,986 | -3.43 |
| Jan-15 | 72,089 | 31.11 |
| Feb-15 | 70,884 | -1.67 |
| Mar-15 | 72,887 | 2.83 |
| Apr-15 | 84,472 | 15.89 |
| May-15 | 78,232 | -7.39 |
Riverside-San Bernardino-Ontario
The Riverside-San Bernardino-Ontario MSA experienced a decrease of 4,167 job openings in May 2015, an 6.72% change from April 2015.
| Month | Total Openings | Percent Monthly Change |
| Jun-14 | 49,141 | 0.42 |
| Jul-14 | 52,360 | 6.55 |
| Aug-14 | 51,924 | -0.83 |
| Sep-14 | 40,018 | -22.93 |
| Oct-14 | 42,870 | 7.13 |
| Nov-14 | 38,138 | -11.04 |
| Dec-14 | 37,377 | -2.00 |
| Jan-15 | 52,811 | 41.29 |
| Feb-15 | 52,141 | -1.27 |
| Mar-15 | 53,849 | 3.27 |
| Apr-15 | 62,004 | 15.15 |
| May-15 | 57,837 | -6.72 |
San Diego-Carlsbad-San Marcos
The San Diego-Carlsbad-San Marcos MSA experienced a decrease of 4,027 job openings in May 2015, an 6.97% change from April 2015.
| Month | Total Openings | Percent Monthly Change |
| Jun-14 | 46,681 | 0.71 |
| Jul-14 | 49,258 | 5.52 |
| Aug-14 | 49,007 | -0.51 |
| Sep-14 | 41,343 | -15.64 |
| Oct-14 | 44,408 | 7.41 |
| Nov-14 | 39,956 | -10.02 |
| Dec-14 | 38,937 | -2.55 |
| Jan-15 | 49,272 | 26.54 |
| Feb-15 | 48,492 | -1.58 |
| Mar-15 | 49,955 | 3.02 |
| Apr-15 | 57,749 | 15.6 |
| May-15 | 53,722 | -6.97 |
Source: BLS