Employment and Wage & Hour Statistics Focus: Consumer Price Index

The Consumer Price Index (CPI) is monthly data released by the Bureau of Labor Statistics on the change in prices paid by urban consumers for a representative basket of goods and services. The CPI is available by region and consumer type. It is most often used to measure inflation, which is an important concern when present-valuing economic damages in the future. Future damages must be discounted by the rate of inflation, because one dollar today is worth more than one dollar tomorrow.

Note: Even though CPIs differ by city, it is not appropriate to use CPI data to compare the cost of living between cities. The CPI does not measure price differentials between cities, but rather only over time. The representative basket of goods and services varies with geographic location.

For information on the Consumer Price Index, please refer to www.bls.gov/cpi

Image source: http://theregister.co.nz/news/2015/08/new-zealands-consumer-price-index-it-accurate-enough

Employstats Employee Focus: Training in D.C.

This past week, Employstats associate Matt Rigling visited Washinton D.C. for a training course led by StataCorp experts. The course was titled Using Stata Effectively: Data Management, Analysis, and Graphics Fundamentals, and was taught by instructor Bill Rising at the MicroTek Training Solutions facility, just a few blocks away from the White House.

Here at Employstats, our analysts utilize the statistical software package Stata for data management, as well as data analysis in all types of wage & hour, economic, and employment analyses. With Stata, all analyses can be reproduced and documented for publication and review.

The training course covered topics ranging from Stata’s syntax to data validation and generation, and even topics such as estimation and post-estimation. “I took away a lot of useful techniques from the Stata course, and I learned about some new features of Stata 14, such as tab auto-complete and the command to turn Stata Markup files into reproducible do-files. Most importantly, I learned data manipulation skills that will help me work more efficiently and accurately.” said associate Matt Rigling.


Employment and Wage & Hour Statistics Focus: Census of Fatal Occupational Injuries

The Census of Fatal Occupational Injuries, conducted by the Bureau of Labor Statistics, provides data on the number of fatal on-the-job injuries by type, occupation, industry, or worker characteristics. This data is sometimes used to statistically value a life. Dangerous jobs tend to offer a wage premium in exchange for additional risk of death on the job. Some economists have attempted to quantify the value of life based on the additional wages that must be paid for a worker to accept an increased chance of a fatal accident.

For more information, visit www.bls.gov/iif/oshcfoi1.htm

Employment and Wage & Hour Statistics Focus: Census

Conducted every ten years, the Census is the largest survey in the United States. The 2010 Census represented the most massive participation movement ever witnessed in the US, with approximately 74% of households returning their census by mail. The Census Bureau hired about 635,000 employees to walk through neighborhoods throughout the United States to count the remaining households.

The 100% characteristics form was used with every person and housing unit in the United States. It includes information on sex, age, and race by geographic location. Census data is available at many geographic levels, including blocks, zip codes, county, and state.

The 2010 Census asked detailed questions that include information on educational attainment, marital status, labor-force status, and income. The Census is a very large database and hence has many uses ranging from racial profiling in police-stop baselines to wage data.

For more information, please go to www.census.gov/

Principles on statistical significance issued by American Statistical Association

The American Statistical Association released an important statement and supporting paper concerning the use and interpretation of statistical significance and p-values in statistical research.
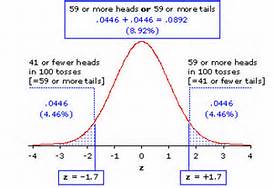
pvalues

The American Statistical Associations’ statement notes that the increased quantification of scientific research and a proliferation of large, complex data sets, often referred to as Big Data, has expanded the scope for statistics.  Accordingly, the importance of appropriately chosen techniques, properly conducted analyses, and correct interpretation has also increased.

This statement by the ASA furthers, and in some ways solidifies, the ground roots “counter-statistical significance” movement that many economists and statisticians, such as Steve Zillack and Diedre McCloskey, have been working on for decades.

Real-World-Matters-Statistically-Significant-1024x509

According to the ASA statement “The p-value [and the concept of statistical significance] was never intended to be a substitute for scientific reasoning,” said Ron Wasserstein, the ASA’s executive director. In research analysts use the data to calculate a p-value which shows how consistent the data is with the research hypothesis.  A small p-value is typically interpreted as having a small likelihood of being consistent with the research hypothesis.   In research papers, small p-values are in essence viewed as a ‘good thing’ and according to the ASA statement, are more favored by journal editors for publication.

The ASA statement argues against this approach.  Instead, the ASA statement states that “Well-reasoned statistical arguments contain much more than the value of a single number and whether that number exceeds an arbitrary threshold.”

See:

Ronald L. Wasserstein & Nicole A. Lazar (2016): The ASA’s statement on p-values: context, process, and purpose, The American Statistician, DOI: 10.1080/00031305.2016.1154108

Ziliak, S.T., and McCloskey, D.N. (2008), The Cult of Statistical Significance: How the Standard Error Costs Us Jobs, Justice, and Lives, Ann Arbor: University of Michigan Press

Ziliak, S.T. (2010), “The Validus Medicus and a New Gold Standard,” The Lancet, 376, 9738, 324-325.


Employment and Wage & Hour Statistics Focus: Current Population Survey

The Current Population Survey (CPS) is a monthly survey of approximately 50,000 households conducted by the Bureau of Labor Statistics (BLS) and the U.S. Census Bureau. The CPS collects a vast amount of data and is an excellent resource for information on labor-force characteristics.

The basic monthly CPS provides general demographic information as well as employment status, industry, and occupation. The monthly survey is often used to examine unemployment rates and the duration of unemployment. The BLS publishes tables reporting the unemployment rate and the average and median duration of unemployment by gender and age, race, or marital status. These tables are generally referenced in wrongful termination cases to show the expected length of time it will take the plaintiff to find a new job.

In addition to the basic monthly survey, the CPS includes monthly supplements. These supplements include displaced workers, job tenure, and mobility, and a demographic supplement (often referred to as the March supplement), just to name a few.

The job tenure supplement can be used to estimate the amount of time an individual would have likely remained at a job if the termination had not occurred. The demographic supplement is often used to determine average and median wages for particular education levels. Additionally, regression analysis can be used to estimate lifecycle earnings for individuals based on their age or years of experience, education, and other pertinent demographic factors.

For more information, please go to www.bls.gov/cps/

Employment and Wage & Hour Statistics Focus: National Longitudinal Survey of Youth

The National Longitudinal Survey of Youth (NLSY) is a Bureau of Labor Statistics longitudinal study that repeatedly surveys approximately 12,000 individuals every two years.  These individuals, who were selected at the beginning of the survey, are followed over time and surveyed on issues such as the individual’s educational and employment experiences.

Ordered probit regressions and the NLSY can be used to estimate the probability of different levels of educational attainment.  The probability of an individual obtaining a high school or college degree can be calculated based on demographic characteristics, such as race and gender, and household characteristics, such as family structure or parental educational attainment levels.

Regression analysis on NLSY data has also been used to estimate the length of time it takes for an individual’s salary to catch up after an employment termination.  This data can be used to determine the appropriate length of damages in wrongful termination cases.

For more information, see http://www.bls.gov/nls.

Employment and Wage & Hour Statistics Focus: Consumer Expenditure Survey

The Consumer Expenditure Survey (CE) is conducted for the US Census Bureau and the Bureau of Labor Statistics. The CE is important because it is the only Federal survey to provide information on the complete range of consumers’ expenditures and incomes, as well as the characteristics of those consumers.  It studies the expenditures, income, and household characteristics of American consumers.  The CE is often used in wrongful death cases to estimate a personal consumption factor.

The personal consumption factor is the amount of income the decedent would have spent on personal expenditures as opposed to income going to the household or other members of the household.  Personal consumption includes expenditures on food, clothing, alcohol, transportation, etc.  This factor is generally estimated using the expenditure data from CE and regression analysis.

2012 statsitcs about American spending

For more information, see http://www.bls.gov/cex.

Image Source: http://www.creditloan.com/media/uploads/sites/2/2014/12/paycheck-of-the-average-american-2013.png

Do employers transmit revenue changes to employee wages? What does BLS big data say about it?

This paper (ASSA 2016 link below) looks to study revenue and sales volatility at the firm level and how that relates to employee level of wages.  The main take away is that employee wages tend to be positively related to revunue shocks. That is, employers tend to keep employee wages steady and increasing over time regardless of the specific shocks that the firm may be experiencing at any given time. 

ASSA 2016 paper

Using Microlevel BLS data to study aggregate wage dispersion

Can Microlevel BLS data be used to study how and why employees are paid differently at US employers ?  This paper and the work ultimately looks to provide a method to use the Microlevel, i.e. individual level survey observations, to match dispersion measures like, the standard deviation, in big data BLS employment data. The first step for the researchers is to try and match the aggregate numbers to the micro numbers.