Compared to September of last year, all of the main Metropolitan Statistical Areas (MSAs) in California saw an annual increase in the number of job openings and an increase in the searcher-to-job opening ratio.
Source: BLS
Compared to September of last year, all of the main Metropolitan Statistical Areas (MSAs) in California saw an annual increase in the number of job openings and an increase in the searcher-to-job opening ratio.
Source: BLS
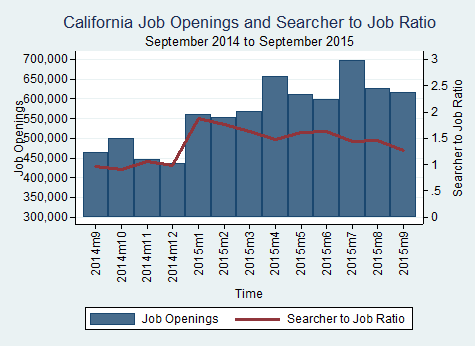
The number of job openings in California decreased from 625,696 in August 2015 to 615,711 in September 2015. The median number of job searchers per job opening across all Metropolitan Statistical Areas (MSAs) and occupations in California also decreased from 1.47 in August 2015 to 1.27 in September 2015.
Source: BLS
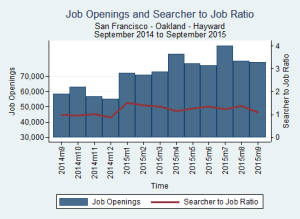
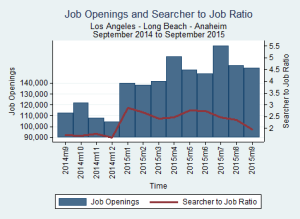
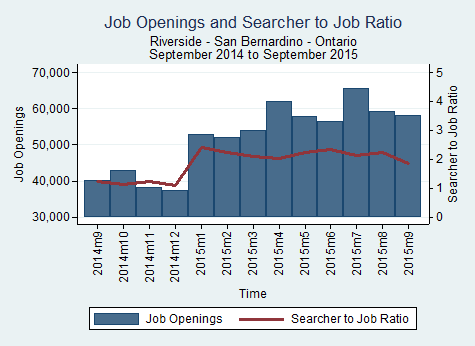
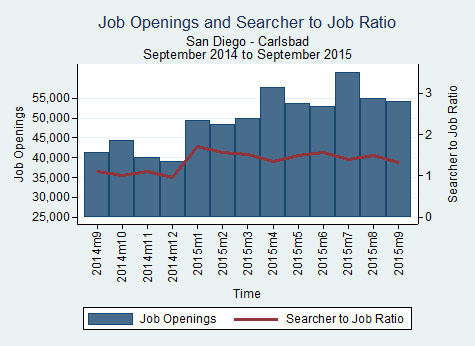
All 4 of the largest Metropolitan Statistical Areas (MSAs) in California experienced a decrease in job openings for the month of August.
Los Angeles – Long Beach – Santa Ana
The Los Angeles-Long Beach-Santa Ana MSA experienced a decrease of 18,134 job openings in August 2015, a -10.4% change from July 2015.
| Month | Total Openings | Percent Monthly Change | |
| Sep-14 | 112,657 | -17.73 | |
| Oct-14 | 121,598 | 7.94 | |
| Nov-14 | 108,123 | -11.08 | |
| Dec-14 | 104,302 | -3.53 | |
| Jan-15 | 140,013 | 34.24 | |
| Feb-15 | 137,967 | -1.46 | |
| Mar-15 | 141,983 | 2.91 | |
| Apr-15 | 164,525 | 15.88 | |
| May-15 | 152,008 | -7.61 | |
| Jun-15 | 148,658 | -2.2 | |
| Jul-15 | 174,288 | 17.24 | |
| Aug-15 | 156,154 | -10.4 |
San Francisco – Oakland – Freemont
The San Francisco-Oakland-Fremont MSA experienced a decrease of 9,854 job openings in August 2015, a -10.95% change from July 2015.
| Month | Total Openings | Percent Monthly Change | |
| Sep-14 | 58,567 | -15.38 | |
| Oct-14 | 63,065 | 7.68 | |
| Nov-14 | 56,940 | -9.71 | |
| Dec-14 | 54,986 | -3.43 | |
| Jan-15 | 72,089 | 31.11 | |
| Feb-15 | 70,884 | -1.67 | |
| Mar-15 | 72,887 | 2.83 | |
| Apr-15 | 84,472 | 15.89 | |
| May-15 | 78,232 | -7.39 | |
| Jun-15 | 77,039 | -1.52 | |
| Jul-15 | 89,946 | 16.75 | |
| Aug-15 | 80,092 | -10.95 |
Riverside – San Bernardino – Ontario
The Riverside-San Bernardino-Ontario MSA experienced a decrease of 6,442 job openings in August 2015, a -9.82% change from July 2015.
| Month | Total Openings | Percent Monthly Change |
| Sep-14 | 40,018 | -22.93 |
| Oct-14 | 42,870 | 7.13 |
| Nov-14 | 38,138 | -11.04 |
| Dec-14 | 37,377 | -2 |
| Jan-15 | 52,811 | 41.29 |
| Feb-15 | 52,141 | -1.27 |
| Mar-15 | 53,849 | 3.27 |
| Apr-15 | 62,004 | 15.15 |
| May-15 | 57,837 | -6.72 |
| Jun-15 | 56,343 | -2.58 |
| Jul-15 | 65,608 | 16.44 |
| Aug-15 | 59,166 | -9.82 |
San Diego – Carlsbad – San Marcos
The San Diego-Carlsbad-San Marcos MSA experienced a decrease of 6,576 job openings in August 2015, a -10.7% change from July 2015.
| Month | Total Openings | Percent Monthly Change |
| Sep-14 | 41,343 | -15.64 |
| Oct-14 | 44,408 | 7.41 |
| Nov-14 | 39,956 | -10.02 |
| Dec-14 | 38,937 | -2.55 |
| Jan-15 | 49,272 | 26.54 |
| Feb-15 | 48,492 | -1.58 |
| Mar-15 | 49,955 | 3.02 |
| Apr-15 | 57,749 | 15.6 |
| May-15 | 53,722 | -6.97 |
| Jun-15 | 52,803 | -1.71 |
| Jul-15 | 61,473 | 16.42 |
| Aug-15 | 54,897 | -10.7 |
Source: BLS
All four of the largest Metropolitan Statistical Areas (MSAs) in Texas experienced a decrease in job openings from July 2015 to August 2015.
Dallas
Dallas experienced a decrease of 12,075 job openings from July 2015 to August 2015, a 10.54% decrease.
| Date | Total Openings | Monthly Change | Yearly Change |
| Aug-15 | 102,497 | -10.54% | 43.49% |
| Jul-15 | 114,572 | 16.84% | 27.63% |
| Jun-15 | 98,055 | -1.64% | 8.25% |
| May-15 | 99,685 | -6.84% | 17.59% |
| Apr-15 | 107,005 | 15.49% | 26.59% |
| Mar-15 | 92,653 | 2.87% | 3.43% |
| Feb-15 | 90,072 | -1.85% | 23.93% |
| Jan-15 | 91,770 | 38.18% | 29.39% |
| Dec-14 | 66,413 | -4.20% | -11.31% |
| Nov-14 | 69,326 | -10.74% | 11.28% |
| Oct-14 | 77,670 | 8.74% | 19.49% |
| Sep-14 | 71,430 | -20.43% | -6.57% |
Austin
Austin experienced a decrease of 5,002 job openings from July 2015 to August 2015, a 10.34% decrease.
| Date | Total Openings | Monthly Change | Yearly Change |
| Aug-15 | 43,395 | -10.34% | 34.13% |
| Jul-15 | 48,397 | 15.94% | 26.28% |
| Jun-15 | 41,742 | -1.41% | 7.20% |
| May-15 | 42,340 | -6.27% | 15.22% |
| Apr-15 | 45,170 | 14.25% | 24.68% |
| Mar-15 | 39,536 | 3.03% | 4.12% |
| Feb-15 | 38,372 | -1.78% | 23.78% |
| Jan-15 | 39,066 | 26.19% | 28.32% |
| Dec-14 | 30,957 | -1.84% | -2.14% |
| Nov-14 | 31,539 | -9.03% | 18.96% |
| Oct-14 | 34,670 | 7.17% | 24.53% |
| Sep-14 | 32,352 | -15.59% | -0.45% |
Houston
Houston experienced a decrease of 10,761 job openings from July 2015 to August 2015, a decrease of 10.58%.
| Date | Total Openings | Monthly Change | Yearly Change |
| Aug-15 | 90,902 | -10.58% | 42.04% |
| Jul-15 | 101,663 | 15.95% | 26.61% |
| Jun-15 | 87,680 | -1.05% | 7.20% |
| May-15 | 88,612 | -6.05% | 17.32% |
| Apr-15 | 94,317 | 14.01% | 24.76% |
| Mar-15 | 82,726 | 3.76% | 3.78% |
| Feb-15 | 79,730 | -2.12% | 20.96% |
| Jan-15 | 81,454 | 35.88% | 28.02% |
| Dec-14 | 59,945 | -3.04% | -10.92% |
| Nov-14 | 61,824 | -11.15% | 10.35% |
| Oct-14 | 69,582 | 8.73% | 19.68% |
| Sep-14 | 63,998 | -20.30% | -5.99% |
San Antonio
San Antonio has experienced a decrease of 4,229 job openings from July 2015 to August 2015, a decrease of 9.5%.
| Date | Total Openings | Monthly Change | Yearly Change |
| Aug-15 | 40,261 | -9.50% | 39.77% |
| Jul-15 | 44,490 | 16.80% | 22.88% |
| Jun-15 | 38,089 | -2.36% | 5.32% |
| May-15 | 39,009 | -7.10% | 14.34% |
| Apr-15 | 41,990 | 15.00% | 23.40% |
| Mar-15 | 36,512 | 2.73% | 1.38% |
| Feb-15 | 35,543 | -1.08% | 22.30% |
| Jan-15 | 35,932 | 34.70% | 26.88% |
| Dec-14 | 26,676 | -3.61% | -10.95% |
| Nov-14 | 27,676 | -11.80% | 12.69% |
| Oct-14 | 31,377 | 8.93% | 21.21% |
| Sep-14 | 28,805 | -20.44% | -4.98% |
Source: BLS
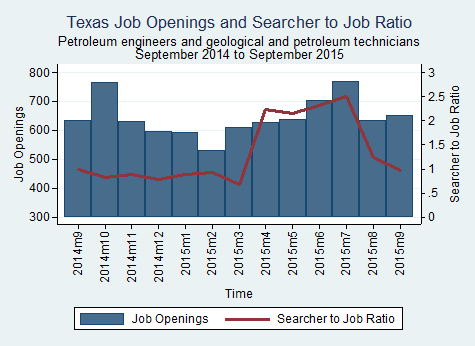
 The number of job openings in Texas for “petroleum engineers” and “geological and petroleum technicians” decreased from 635 in August 2015 to 653 in September 2015, while the searcher-to-job opening ratio decreased from 1.23 to 0.96 in the same span.
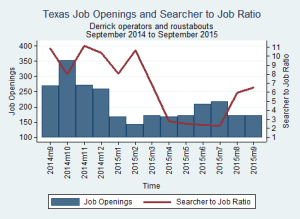
The number of job openings in Texas for “derrick operators” and “roustabouts” increased from 171 in August 2015 to 173 in September 2015, while the searcher-to-job opening ratio increased from 5.96 to 6.50 in the same span.
Source: BLS
Image source: http://wonderfulengineering.com/what-is-petroleum-engineering/
California experienced an increase of 198 innovation job openings from August 2015 to September 2015, an increase of 0.72%. Texas experienced an increase of 96 innovation job openings from August 2015 to September 2015, an increase of 0.65%.

| State | Total Openings | Monthly Change | Yearly Change |
| CA | 27,692 | 0.72% | 7.85% |
| TX | 14,906 | 0.65% | 9.86% |
Innovation jobs definition: http://www.employstats.com/blog/2014/09/26/1233/
Source: BLS
Image source: http://www.bizjournals.com/sacramento/news/2013/09/23/symposium-innovation-ecosystems-jobs-wea.html
In this post, we look at the weekly overtime (OT) hours typically worked by food service managers. Many of the employees that work in these jobs are not exempt from FLSA overtime pay and earn 1.5 times pay for hours worked over 40 in a given week. The tabulations below are based on U.S. Bureau of Labor Statistics (BLS) survey data. The BLS job title groups are insightful, generally containing more specific job titles with similar knowledge, skills, and abilities (KSA), but can be more broad than a particular company’s job title listing. Also, some companies may have the job title listed here as exempt from FLSA or state OT due to their specific job assignments. The BLS does not make a distinction as to if the job title is exempt or non-exempt from OT.
| Occupational Group Title | Percent of OT Workers | Average Hours of OT | 1 out of every 4 (25%) OT workers works at least: |
| Food Service Managers | 47.14% | 16.59 hours | 60 hours |
U.S. BLS data indicates that approximately 47.14% of food service managers work overtime hours in a given week. On average, these workers that have FLSA overtime work approximately 16.59 hours a week in OT. The average regular or straight time pay rate of these workers in the U.S. is approximately $18.57 an hour. The average FLSA OT rate, not including supplemental pay such as non-discretionary bonus pay, is $27.85 an hour.
Source: BLS (CPS March)
In this post, we look at the weekly overtime (OT) hours typically worked by telemarketers. Many of the employees that work in these jobs are not exempt from FLSA overtime pay and earn 1.5 times pay for hours worked over 40 in a given week. The tabulations below are based on U.S. Bureau of Labor Statistics (BLS) survey data. The BLS job title groups are insightful, generally containing more specific job titles with similar knowledge, skills, and abilities (KSA), but can be more broad than a particular company’s job title listing. Also, some companies may have the job title listed here as exempt from FLSA or state OT due to their specific job assignments. The BLS does not make a distinction as to if the job title is exempt or non-exempt from OT.
| Occupational Group Title | Percent of OT Workers | Average Hours of OT | 1 out of every 4 (25%) OT workers works at least: |
| Telemarketers | 21.43% | 11.67 hours | 60 hours |
U.S. BLS data indicates that approximately 21.43% of telemarketers work overtime hours in a given week. On average, these workers that have FLSA overtime work approximately 11.67 hours a week in OT. The average regular or straight time pay rate of these workers in the U.S. is approximately $8.48 an hour. The average FLSA OT rate, not including supplemental pay such as non-discretionary bonus pay, is $12.72 an hour.
Source: BLS (CPS March)
![]()
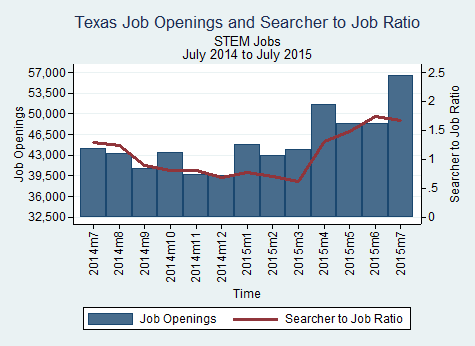
The number of job openings in Texas for STEM (science, technology, engineering, math) jobs increased from 48,441 in June to 56,433 in July 2015. The searcher-to-job opening ratio decreased from 1.73 to 1.67 in the same span.
Our definition of STEM jobs: http://www.employstats.com/blog/2014/09/19/growing-national-interest-in-stem-fields-has-focused-our-research/
Source: BLS
Image source: http://projecttomorrowblog.blogspot.com/2013/11/i-am-scientist.html
The top three occupations with the most new job openings in Texas for the month of July were Driver/Sales Workers and Truck Drivers with 1,084 new openings, Managers with 1,061 new openings, and Cashiers with 1,145 new openings.
July 2015
| Occupation | Total Openings | New Openings |
| Driver/Sales Workers and Truck Drivers | 7,552 | 1,084 |
| Managers | 7,951 | 1,061 |
| Cashiers | 7,149 | 1,145 |
Source: BLS