Texas Job Market Sees Increased Demand for Medical, Supply Chain Workers Amid Coronavirus

The 2020 coronavirus outbreak has sparked severe shocks to the United States labor market. Social distancing policies, designed to slow the spread of the disease, are leading to large layoffs in specific industries, like bars and restaurants. Many more employees in other sectors face the prospect of unemployment or temporary furloughs. Despite this economic strain, employers, particularly those in Medical and Supply Chain services, are expanding to meet new demand. These sectors continue to post job opportunities long after policymakers mandated the closure of non-essential services or issued “shelter-in-place” orders.

Evidence from Texas over the past half-month reveals both predictable and unexpected trends in new job opportunities. It may come as a surprise that, even in this “lockdown economy,” there is still help wanted.

Beginning on March 18th, Texas began implementing statewide social distancing policies, though some areas began issuing such orders days earlier. Cities and counties across the state gradually adopted “shelter-in-place” orders in March.  By March 31st, a statewide order asked residents to stay home, except if they participated in “essential services and activities.”

But within the past two weeks, Texas employers posted over 66,000 new job openings.

Daily job postings are one indicator of up-to-date labor market demand, available from a variety of sources (most notably online).  The Texas Workforce Commission (“TWC”) is the state agency responsible for managing and providing workforce development services to employers and potential employees in Texas.  One service the TWC provides is access to databases of up-to-date job postings for different occupations and employers within the state. These job postings can come from the TWC itself, or from third party sites like Monster or Indeed. This information is extraordinarily valuable to data scientists.

The top 10 in demand occupations cover a variety of occupations, but are heavily concentrated in the healthcare, supply chain, and IT sectors.

Given the stresses to the healthcare system, its little surprise that hospitals are looking for more front-line staff. Registered Nurses were the highest in demand occupation, with over 3,000 new job listings since March 23rd.


Retail supply chains are also expanding employment.  Sales Representatives for Wholesalers and Manufacturers, with over 2,300 new listings, was the second highest in demand occupation. Other logistical occupations saw large numbers of new openings, particularly for Truck Drivers, with over 1,200 new job postings since March 23rd.

Anecdotally, supermarkets and retail chains have been hiring more employees to meet increased demand for groceries and other supplies. Evidence from jobs posted since March 23rd would support this finding, with large increases in new listings for Customer Service Representatives (over 1,700), Supervisors of Retail Sales Workers (over 1,600), and Retail Salespersons (also over 1,600).

Finally, with the increase in service sector employees working from home, it should not be surprise that IT workers are also in high demand. Application Developers (over 2,100 new listings) and employees for general Computer Occupations (with 1,800 new listings) have both seen large increases in openings since March 23rd.

EmployStats will be closely monitoring daily job postings as the coronavirus outbreak continues.

EmployStats Publishes Big Data Book

Big Data permeates our society, but how will it affect U.S. courts? In civil litigation, attorneys and experts are increasingly reliant on analyzing of large volumes of electronic data, which provide information and insight into legal disputes that could not be obtained through traditional sources. There are limitless sources of Big Data: time and payroll records, medical reimbursements, stock prices, GPS histories, job openings, credit data, sales receipts, and social media posts just to name a few.  Experts must navigate complex databases and often messy data to generate reliable quantitative results. Attorneys must always keep an eye on how such evidence is used at trial. Big Data analyses also present new legal and public policy challenges in areas like privacy and cybersecurity, while advances continue in artificial intelligence and algorithmic design.  For these and many other topics, Employstats has a roadmap on the past, present, and future of Big Data in our legal system.

Order your copy of Dr. Dwight Steward and Dr. Roberto Cavazos’ book on Big Data Analytics in U.S. Courts!

Economics and Statistics Experts in Wage and Hour Litigation

Complex wage and hour litigation often involves significant data management and sophisticated analyses in order to assess potential liability and damages. This article highlights common wage and hour data management issues, sampling and surveying, as well as provides a case study as an example of the use of sampling in an overtime misclassification case.

Download Dr. Dwight Steward and Matt Rigling’s paper on wage and hour expert economists here!

Economics and Statistics Experts in Wage and Hour Litigation

Back Pay and Front Pay Calculations in Employment Termination Cases

Most plaintiffs in employment termination cases will ultimately become re-employed. This article discusses the factors that comprise a standard economic damage model in an employment termination case.

Download Dr. Dwight Steward’s paper on Back Pay and Front Pay Calculations in Employment Termination Cases here!

Back Pay and Front Pay Calculations in Employment Termination Cases

EmployStats Gives Back

On Thursday September 12th, the EmployStats team will be sponsoring the Boys & Girls Clubs of the Austin Area Club Classic – UT Legends.  The event will be hosted at Top Golf Austin, with special guest University of Texas Alumni and NFL star Jamaal Charles. Team members Matt Rigling, Carl McClain, and Susie Wirtanen will be teeing off in support of the Boys & Girls Clubs.  Dr. Dwight Steward serves as a board member of the Boys & Girls Clubs of the Austin Area, as part of EmployStats’ mission to give back to the local Austin community. It should be a wonderful event for an even better cause! We hope to see y’all there!


Simpson’s Paradox in Action

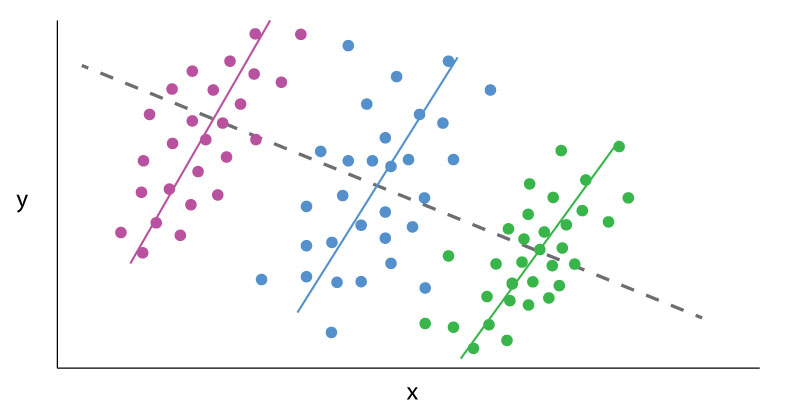
Data Analytics can sometimes be a frustrating game of smoke and mirrors, where outputs change based on the tiniest alterations in perspective. The classic example is Simpson’s paradox.

Simpson’s paradox is a common statistical phenomenon which occurs whenever high-level and subdivided data produce different findings. The data itself may be error free, but how one looks at it may lead to contradictory conclusions. A dataset results in a Simpson’s paradox when a “higher level” data cut reveals one finding, which is reversed at a “lower level” data cut. Famous examples include acceptance rates by gender to a college, which vary by academic department, or mortality rates for certain medical procedures, which vary based on the severity of the medical case. The presence of such a paradox does not mean one conclusion is necessarily wrong; rather, the presence of a paradox in the data warrants further investigation.

“Lurking variables” (or “confounding variables”) are one key to understanding Simpson’s paradox. Lurking variables are those which significantly affect variables of interest, like the outputs in a data set, but which are not controlled for in an analysis. These lurking variables often bias analytical outputs and exaggerate correlations. However, improperly “stratifying data” is also key to Simpson’s paradox. Aggressively sub-dividing data into statistically insignificant groupings or controlling for unrelated variables can generate inconclusive findings. Both forces operate in opposing directions. The solution to the paradox is to find the data cut which is most relevant to answering the given question, after controlling for significant variables.

EmployStats recently worked on an arbitration case out of Massachusetts, where the Plaintiffs alleged that a new evaluation system negatively impacted older and minority teachers more than their peers in a major public school district. One report provided by the Defense examined individual evaluators in individual years, arguing that evaluators were responsible for determining the outcome of teacher evaluations. This report determined, based on that data cut, the new evaluation system showed no statistical signs of bias. By contrast, the EmployStats team systematically analyzed all evaluations, controlling for different factors such as teacher experience, the type of school, and student demographics. The team found that the evaluations, at an overall level and after controlling for a variety of variables, demonstrated a statistically significant pattern of biases against older and minority teachers.

The EmployStats team then examined the Defense’s report. The team found that if all the evalulator’s results were jointly tested, the results showed strong, statistically significant biases against older and minority teachers, which matched the Plaintiff’s assertions. If the evaluators really were a lurking variable, then specific evaluators should have driven a significant number of results. Instead, the data supported the hypothesis that the evaluation system itself was the cause of signs of bias.

To see how EmployStats can assist you with similar statistics cases, please visit www.EmployStats.com or give us a call at 512-476-3711.  Follow our blog and find us on social media: @employstatsnews

Benford’s Law and Fraud Detection

Civil fraud cases hinge on litigants proving where specific fraudulent activity occurred. Tax returns, sales records, expense reports, or any other large financial data set can be manipulated. In many instances of fraud, the accused party diverts funds or creates transactions, intending to make their fraud appear as ordinary or random entries. More clever fraudsters ensure no values are duplicated or input highly specific dollar and cent amounts. Such ‘random’ numbers, to them, may appear normal, but few understand or replicate the natural distribution of numbers known as Benford’s Law.

A staple of forensic accounting, Benford’s Law is a useful tool for litigants in establishing patterns of fraudulent activity.

Benford’s Law states that, for any data set of numbers, the number 1 will be the leading numeral about 30% of the time, the number 2 will be the leading numeral about 18% of the time, and each subsequent number (3-9) will be a leading number with decreasing frequency.  This decreasing frequency of numbers, from 1 though 9, can be represented by a curve that looks like this:

Frequency of each leading digit predicted by Benford’s Law.

For example, according to Benford’s Law, one would expect that more street addresses start with a 1 than a 8 or 3; such hypothesis can be tested and proven. The same pattern holds for any number of phenomenon: country populations, telephone numbers, passengers on a plane, or the volumes of trades. This predicted distribution permeates many aspects of numbers and big data sets. But Benford’s Law is not absolute: it does require larger data sets, and that all the leading digits (1-9) must have a theoretically equal chance of being the leading digit. Benford’s Law, for example, would not apply to a data set where only 4s or 9s are the leading number. Financial data sets do comport with a Benford distribution.

In accounting and financial auditing, Benford’s Law is used to test a data set’s authenticity. False transaction data is typically tampered by changing values or adding additional fake data. The test, therefore, is an early indicator if a data set has been altered or artificially created. Computer generated random numbers will tend to show an equal distribution of leading digits. Even manually created false entries will tend to have some sort of underlying pattern. A person may, for example, input more fake leading digits based on numbers closer to their typing fingers (5 and 6).

An examiner would compare the distribution of leading digits in the data set, and the Benford distrubtion. Then, the examiner would statistically test if the proportion of leading numbers in the data set matches a Benford distribution. The resulting “Z-scores” give a measure of how distorted these distributions are, with higher “Z-scores” implying a more distorted data set, which implies artificially created data.

If a data set violates Benford’s Law, that alone does not prove such transactions numbers fraudulent. But, a violation does give auditors, economists, and fact finders an additional reason to scrutinize individual transactions.

Sampling in Wage and Hour Cases

Often in wage and hour cases, attorneys are faced with the decision of analyzing the complete time and payroll records for a class population, or analyzing just a sample of the population’s records.  While in an ideal world, analyzing the full population of data is the best approach, it may not always be feasible to do so.

For instance, some of the individuals within the class may be missing records due to poor data management, or perhaps both sides agree that the analysis of the full population may be too costly or time consuming.  In these cases, the attorneys can elect to have an expert randomly select a random sample from the full population to perform a reliable and statistically significant random sample.

Below are some common terms related that attorney’s can expect to hear when discussing sampling in their wage and hour cases:

Random Sampling, n. sampling in which every individual has a known probability of being selected.

Sample, n. a set of individuals or items drawn from a parent population.

Sample Size, n. the number of individuals or items in a sample.

Simple Random Sampling, n. sampling in which every individual has an equal probability of being selected and each selection is independent of the others.

Discussion: This very common statistical routine is analogous to ‘pulling a name out of a hat’.

Stratified Sampling, n. a method of statistical sampling that draws sub-samples from different sections, or strata, of the overall data population.

Discussion: Stratified sampling routines are used in employment settings when there are important differences between different groups of employees being surveyed. For example, in a survey of off-the-clock work, workers at different locations, and with different supervisors, may have different work cultures that make them more (or less) likely than other workers to have worked during their lunch period. In this instance, a stratified sampling routine may be used to account for those differences.


Case Update: Mileage Reimbursement

The scope of Wage and Hour cases can extend beyond traditional claims on overtime or off-the-clock work. The same analytical principles can extend, for example, to cases involving employee reimbursements. EmployStats has recently worked on a case in California where the Plaintiffs allege they were not reimbursed for routine miles traveled in personal vehicles between job sites, despite the Defendant’s stated policy.

The EmployStats team assessed the Plantiffs’ theory of liability and estimated unreimbursed expenses based off of the available case data on mileage, parking, and toll charges. The analysis presented to the court showed a significant difference between stated and actual reimbursements for miles traveled by the Plantiffs. Based off of the analysis and other evidence at trial, the court certified the Plaintiff class.

The EmployStats Wage and Hour Consulting team’s trial plan is as follows:

  1. First, the EmployStats team would survey a statistically representative sample of class members about the existence of unreimbursed miles, using a random sampling methodology to eliminate potential bias.
  2. Next, the team would use a similar statistical sampling methodology to determine the typical miles traveled by the class members, and combining this resulting data with mapping platforms (ex. Google Maps API) to calculate distances in miles traveled between job locations.
  3. Finally, Employstats would tabulate damages based off of these results, using publicly available data on reimbursement rates for miles traveled in personal vehicles.
A copy of the court’s order can be found though the link here: McLeod v Bank of America Court Order – Dwight Steward PhD Statistical Sampling Plan
To see how EmployStats can assist you with similar employment or statistics cases, please visit www.EmployStats.com or give us a call at 512-476-3711.  Follow our blog and find us on social media! @employstatsnews

Big Data CLE in Baltimore, MD

On April 5, 2019, Dr. Dwight Steward, Ph.D. will be speaking alongside Robert Cavazos, Ph.D., Kyle Cheek, Ph.D., and Vince McKnight.  The experts and attorney will be presenting together on a panel at the EmployStats sponsored CLE seminar, titled Data Analytics in Complex Litigation.  The seminar will take place at the University of Baltimore in the Merrick School of Business, and will run from 9:30 AM to 1:30 PM.


The speakers will cover a spectrum of issues on Big Data Analytics, and its use in legal applications.  Specifically, the general session of the CLE will provide an overview of data analytics in a legal context, discussing the various aspects of how to manage large data sets in complex litigation settings.  Attendees will then be able to choose between two breakout sessions, Data Analytics in Litigation and Healthcare Litigation.  Lunch will be included.


To find out more on the upcoming CLE, visit: www.bigdatacleseminar.com

Also, make sure to follow our blog and stay up to date with Employstats news and sponsored events! www.EmployStats.com