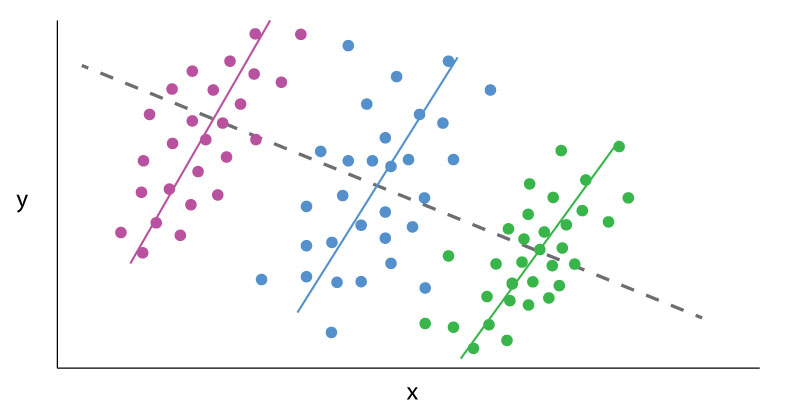
Data Analytics can sometimes be a frustrating game of smoke and mirrors, where outputs change based on the tiniest alterations in perspective. The classic example is Simpson’s paradox.
Simpson’s paradox is a common statistical phenomenon which occurs whenever high-level and subdivided data produce different findings. The data itself may be error free, but how one looks at it may lead to contradictory conclusions. A dataset results in a Simpson’s paradox when a “higher level” data cut reveals one finding, which is reversed at a “lower level” data cut. Famous examples include acceptance rates by gender to a college, which vary by academic department, or mortality rates for certain medical procedures, which vary based on the severity of the medical case. The presence of such a paradox does not mean one conclusion is necessarily wrong; rather, the presence of a paradox in the data warrants further investigation.
“Lurking variables” (or “confounding variables”) are one key to understanding Simpson’s paradox. Lurking variables are those which significantly affect variables of interest, like the outputs in a data set, but which are not controlled for in an analysis. These lurking variables often bias analytical outputs and exaggerate correlations. However, improperly “stratifying data” is also key to Simpson’s paradox. Aggressively sub-dividing data into statistically insignificant groupings or controlling for unrelated variables can generate inconclusive findings. Both forces operate in opposing directions. The solution to the paradox is to find the data cut which is most relevant to answering the given question, after controlling for significant variables.
EmployStats recently worked on an arbitration case out of Massachusetts, where the Plaintiffs alleged that a new evaluation system negatively impacted older and minority teachers more than their peers in a major public school district. One report provided by the Defense examined individual evaluators in individual years, arguing that evaluators were responsible for determining the outcome of teacher evaluations. This report determined, based on that data cut, the new evaluation system showed no statistical signs of bias. By contrast, the EmployStats team systematically analyzed all evaluations, controlling for different factors such as teacher experience, the type of school, and student demographics. The team found that the evaluations, at an overall level and after controlling for a variety of variables, demonstrated a statistically significant pattern of biases against older and minority teachers.
The EmployStats team then examined the Defense’s report. The team found that if all the evalulator’s results were jointly tested, the results showed strong, statistically significant biases against older and minority teachers, which matched the Plaintiff’s assertions. If the evaluators really were a lurking variable, then specific evaluators should have driven a significant number of results. Instead, the data supported the hypothesis that the evaluation system itself was the cause of signs of bias.
