 Modeling business profit losses
As discussed in a
previous post, the plaintiff in this case is suing their landlord for breach of contract. The plaintiff alleges that the defendant landlord misrepresented the terms of the contract, specifically regarding how the property that they were leasing could be used.
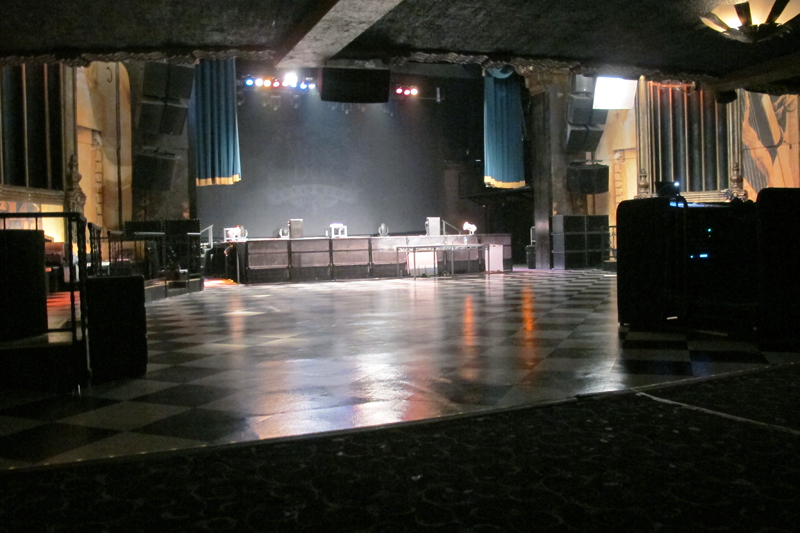
At the heart of the issue, the plaintiff alleges that the defendant represented that they would be able to operate a live music venue restaurant from the location. The plaintiff alleges that the defendant’s failure to support the permitting and rezoning efforts constituted a breach of contract.
The premise lease was for 10 years. The plaintiff operated the live music for two years. In year three, since the facility did not have the proper permits, the facility operated as a restaurant that also provided catering and was also a destination for weddings and other events. The defendant terminated the lease after 3 years.
So how are damages analysed?
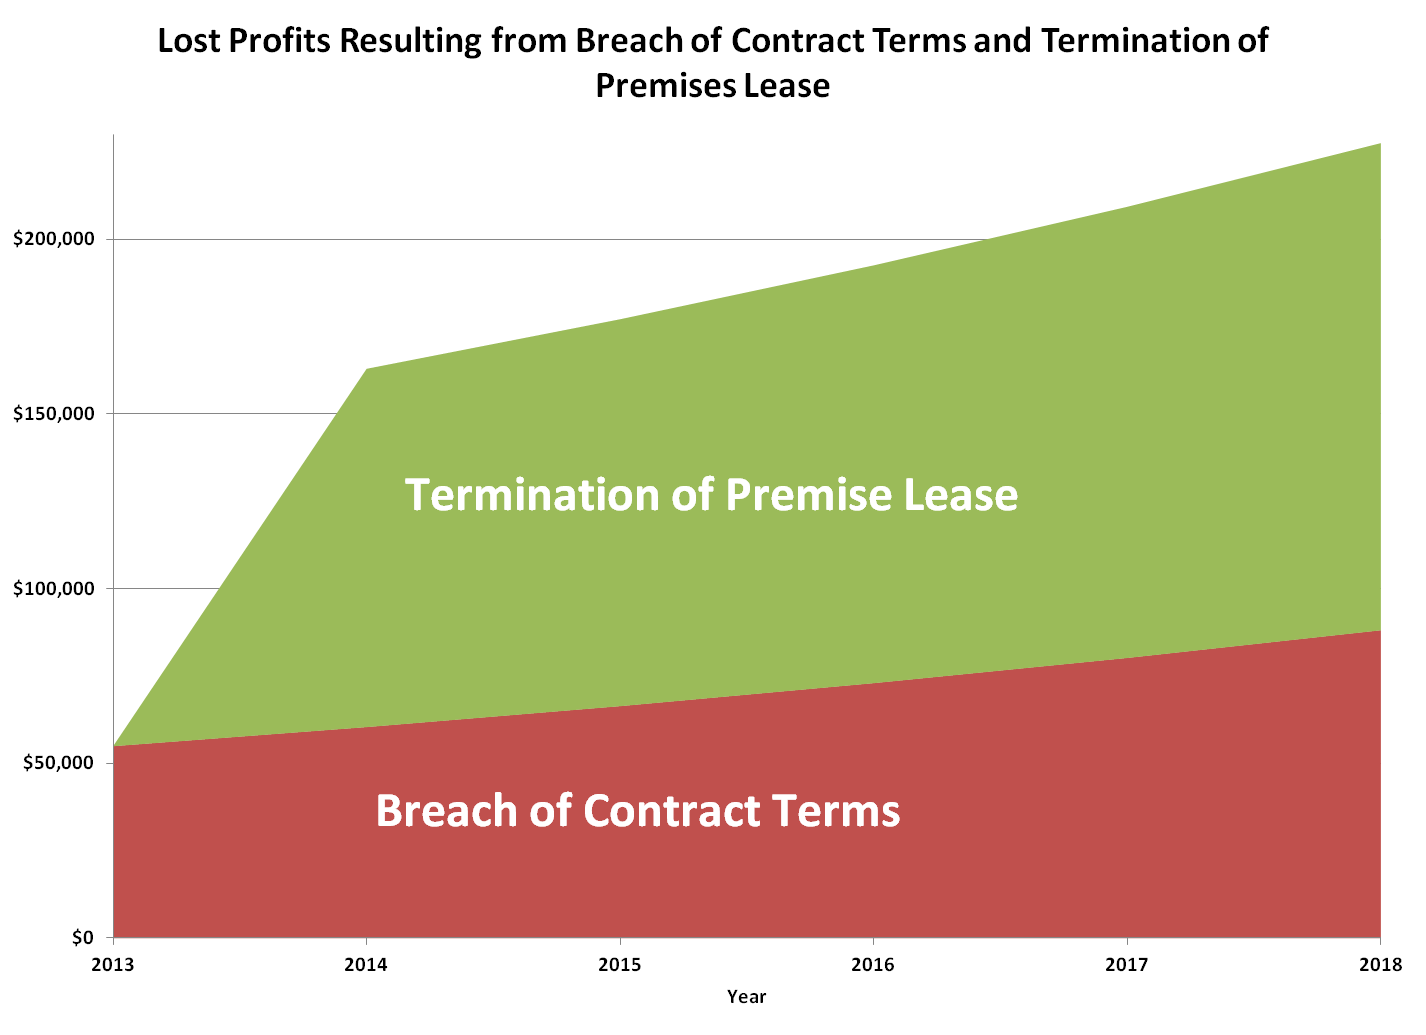
In this case there are three distinct types of damages: lost out-of-pocket expenses, lost profits from the termination of the premise lease, and lost expected profits from the performance of the contract. In this case, the three different types of damages are distinct.
Lost out-of-pocket expenses:
These are the expenses that the plaintiff expended on services and products, such remodeling the interior, architects, construction etc., but was not allowed to use because of the defendants actions.
The total cost of some items such as the cost of professionals hired to complete the re-zoning applications, is included in the analysis. In other situations, the un-used portion is relevant. For instance, the plaintiff constructed special performance stages and purchased sound equipment for the outside music performance, which they were able to use for three years. In these instances, the value of the use that the plaintiff received needs to be deducted, along with any salvage value, from the plaintiff’s cost.
Lost profits from the termination of the premise lease:
In this case, these are the losses associated with having to operate at a lower capacity. It will in essence be the difference between the profits that the plaintiff could have continued to earn had they continued to operate as a restaurant without the live music venue (‘but-for’ reduced operating earnings) and what they actually earned ($0) from the business following the termination of the lease. In this case, the plaintiff actually could, and did, operate the facility as a restaurant and wedding reception facility. The earnings and profits from year three, the time period that the business operated as a restaurant and special events facillity only, is used as a benchmark for the reduced operating capacity ‘but-for’ profits projections. The business shut down after the lease ended so the actual earnings are $0.
Lost expected profits from full performance of the contract:
These are the alleged lost profits associated with the revenue that the business would have earned had the defendant fully performed the contract and performed the necessary steps for the plaintiff to operate the live music venue on the leased premise.
The lost expected profits are calculated as the difference between the ‘but-for’ profits that the plaintiff would have earned had the defendant fully performed the contract and the business was allowed to operate as a live music venue and the profits that the plaintiff could have earned had they continued to operate the business in its reduced capacity as a restaurant-special events facility only. In this instance, the revenue from the two year time period is used to provide the benchmark for the ‘but-for’ and full contract performance profits.

 When manual data entry of non-analyzable financial or wage data is not an option, OCR software and specialized designed and written computer software data cleaning routines is a good alternative.
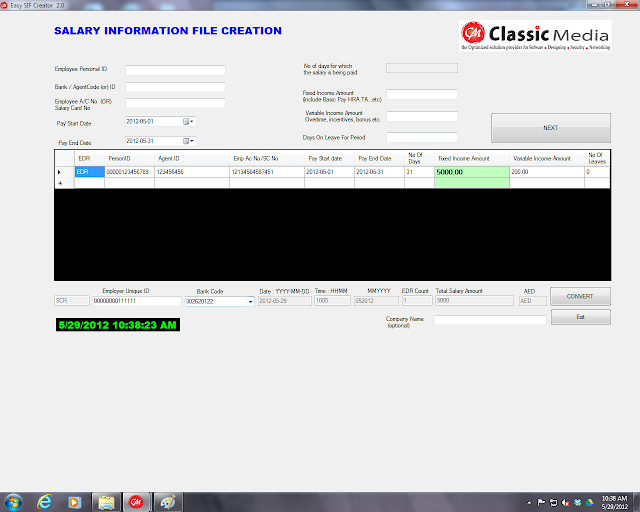 Some wage and business data is electronic but is not analyzable in the format that it is maintained by the employer or company.
 Lost profits arising from the injury of a principal employee or owner require an analysis of the actual and ‘but-for’ revenue of the business entity. The date(s) the alleged economic damage to the business began and end is an obvious stating point in the business damages analysis.