Calculating Damages and Customizing Labor Market Data

In employment and economic damage cases, knowing the plaintiff’s re-employment opportunities and job search efforts is crucial in calculating damages. 

Each plaintiff’s knowledge and responsibilities are used to analyze labor market conditions and supplies. What makes EmployStats unique is our ability to customize and personalize labor market data to best match our plaintiff’s expertise level. We utilize a number of data sources including electronic job search data and public labor data sources such as the U.S. Bureau of labor statistics (BLS) for analyzing labor mitigation cases.

Obtaining this information based on labor market conditions and labor market supply allows us to customize our data based on each plaintiff’s characteristics making the labor mitigation analysis unique.


For more information contact us at 1-866-629-0011 or info@employstats.com.

EmployStats at the Upcoming NELA Spring Seminar

EmployStats is honored to be attending and speaking at the upcoming National Employment Lawyers Association (NELA) Spring Seminar.  The seminar, titled Epic Advocacy: Protecting Wages in Litigation & Arbitration will take place in Denver, CO on April 12-13, 2019.  


EmployStats’ principal economist Dwight Steward, Ph.D., and Matt Rigling, MA, will be presenting alongside attorneys Michael A. Hodgson and Dan Getman.  The speaker’s session, Calculating Damages: Views from an Expert and Lawyers, will discuss all relevant aspects of calculating and proving liability and damages in wage and hour cases.


The panelists will present the options attorneys face when attempting to tabulate damages, discuss the best practices for obtaining and analyzing data, as well as discuss common wage and hour issues such as sampling and surveys.  EmployStats’ statistical experts will also provide statistical background as they relate to labor and employment class action lawsuits, such as a explaining statistical significance, confidence intervals, stratified sampling, and margin of error.


We hope to see you at the upcoming NELA Spring Seminar in Denver on April 13, we would love to meet and discuss how EmployStats can assist you with your wage and hour lawsuit.  To find out more about the seminar, please visit the NELA Website. For more on EmployStats, visit the EmployStats Website.

Employment and Wage & Hour Statistics Focus: Occupational Employment Statistics

The Occupational Employment Statistics (OES) program, conducted by the Bureau of Labor Statistics (BLS), provides employment and wage information by occupation and geographic location. Hourly and annual mean and median wages are available for more than 800 different occupations at the national, regional, state, and MSA level.

According to the latest OES news release, the healthcare industry employed 12 million people in May 2015, which represents nearly 9% of the nation’s total employment. Registered nurses (2.7 million), nursing assistants (1.4 million), and home health aides (820,630) were the largest healthcare occupations.

For more information, please refer to www.bls.gov/oes


Employment and Wage & Hour Statistics Focus: Local Area Unemployment Statistics

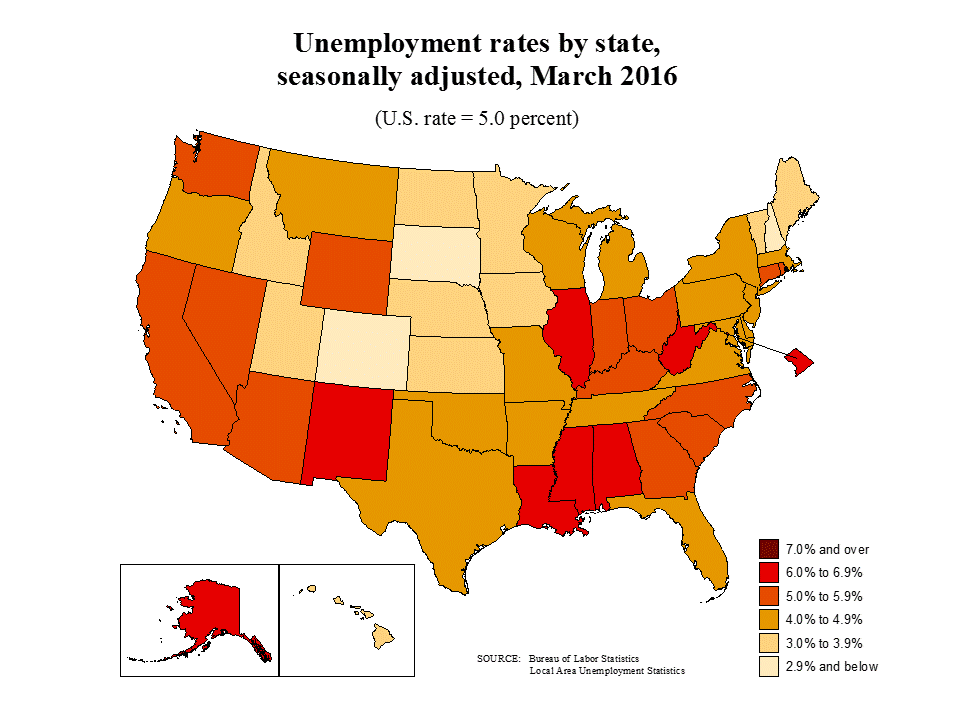
Local Area Unemployment Statistics (LAUS) is made available by the Bureau of Labor Statistics (BLS), and offers monthly data on employment and unemployment for approximately 7,500 geographic areas. Unemployment rates are available monthly by county, MSA, and state level.

These estimates are key indicators of local economic conditions, and may be compared over time to examine changes in the labor market.

For more information regarding the LAUS, please refer to www.bls.gov/lau

Employment and Wage & Hour Statistics Focus: Job Openings and Labor Turnover Survey

The Job Openings and Labor Turnover Survey  (JOLTS) is a monthly survey conducted by the Bureau of Labor Statistics. JOLTS collects data on total employment, the number of job openings, the number of hires, and the number of separations including quits and layoffs. JOLTS can be used to measure the growth of a particular industry and to better understand labor-market opportunities.

According to the latest release on April 5th, 2016, job hires in the United States increased to 5.4 million in February 2016, while during this same period separations made little change at 5.1 million.

For more information on the JOLTS, please refer to www.bls.gov/jlt


Employment and Wage & Hour Statistics Focus: Equal Employment Opportunity Census

The Equal Employment Opportunity (EEO) Census is a tabulation created every ten years for the purpose of serving as an external benchmark for comparing the composition of a company’s workforce to that of the external labor market within a specific geographic area and job category. The EEO Census provides worker counts based on race, ethnicity, gender, age, education level, industry, occupation, and geography. While the raw data is not readily available, 24 tables provide counts for varying cuts of the data.

The EEO Census is most often seen in Affirmative Action Plans and EEO Commission compliance reviews. It is also useful in the litigation setting companies when there are allegations of discrimination.

For more information, please refer to: www.census.gov/hhes/www/eeoindex/eeoindex.html

Employment and Wage & Hour Statistics Focus: Consumer Price Index

The Consumer Price Index (CPI) is monthly data released by the Bureau of Labor Statistics on the change in prices paid by urban consumers for a representative basket of goods and services. The CPI is available by region and consumer type. It is most often used to measure inflation, which is an important concern when present-valuing economic damages in the future. Future damages must be discounted by the rate of inflation, because one dollar today is worth more than one dollar tomorrow.

Note: Even though CPIs differ by city, it is not appropriate to use CPI data to compare the cost of living between cities. The CPI does not measure price differentials between cities, but rather only over time. The representative basket of goods and services varies with geographic location.

For information on the Consumer Price Index, please refer to www.bls.gov/cpi

Image source: http://theregister.co.nz/news/2015/08/new-zealands-consumer-price-index-it-accurate-enough

Employment and Wage & Hour Statistics Focus: Census of Fatal Occupational Injuries

The Census of Fatal Occupational Injuries, conducted by the Bureau of Labor Statistics, provides data on the number of fatal on-the-job injuries by type, occupation, industry, or worker characteristics. This data is sometimes used to statistically value a life. Dangerous jobs tend to offer a wage premium in exchange for additional risk of death on the job. Some economists have attempted to quantify the value of life based on the additional wages that must be paid for a worker to accept an increased chance of a fatal accident.

For more information, visit www.bls.gov/iif/oshcfoi1.htm

Employment and Wage & Hour Statistics Focus: Census

Conducted every ten years, the Census is the largest survey in the United States. The 2010 Census represented the most massive participation movement ever witnessed in the US, with approximately 74% of households returning their census by mail. The Census Bureau hired about 635,000 employees to walk through neighborhoods throughout the United States to count the remaining households.

The 100% characteristics form was used with every person and housing unit in the United States. It includes information on sex, age, and race by geographic location. Census data is available at many geographic levels, including blocks, zip codes, county, and state.

The 2010 Census asked detailed questions that include information on educational attainment, marital status, labor-force status, and income. The Census is a very large database and hence has many uses ranging from racial profiling in police-stop baselines to wage data.

For more information, please go to www.census.gov/

Employment and Wage & Hour Statistics Focus: Current Population Survey

The Current Population Survey (CPS) is a monthly survey of approximately 50,000 households conducted by the Bureau of Labor Statistics (BLS) and the U.S. Census Bureau. The CPS collects a vast amount of data and is an excellent resource for information on labor-force characteristics.

The basic monthly CPS provides general demographic information as well as employment status, industry, and occupation. The monthly survey is often used to examine unemployment rates and the duration of unemployment. The BLS publishes tables reporting the unemployment rate and the average and median duration of unemployment by gender and age, race, or marital status. These tables are generally referenced in wrongful termination cases to show the expected length of time it will take the plaintiff to find a new job.

In addition to the basic monthly survey, the CPS includes monthly supplements. These supplements include displaced workers, job tenure, and mobility, and a demographic supplement (often referred to as the March supplement), just to name a few.

The job tenure supplement can be used to estimate the amount of time an individual would have likely remained at a job if the termination had not occurred. The demographic supplement is often used to determine average and median wages for particular education levels. Additionally, regression analysis can be used to estimate lifecycle earnings for individuals based on their age or years of experience, education, and other pertinent demographic factors.

For more information, please go to www.bls.gov/cps/