Review of Bracewell Giuliani’s ShalePlay App on the Shale industry

ShaleAppphoto

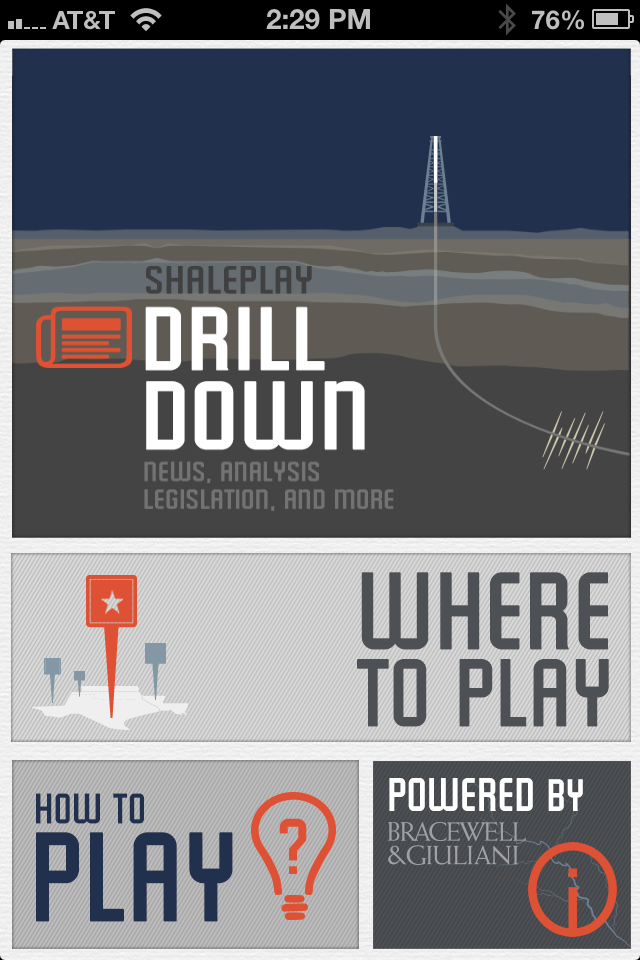
Bracewell Giuliani’s ShalePlay app for IPhone is a one stop information source for professionals who are interested in learning more about the Shale industry.  The app has three main sections: Drill Down, Where to Play, and How to Play.

DrillDownphoto

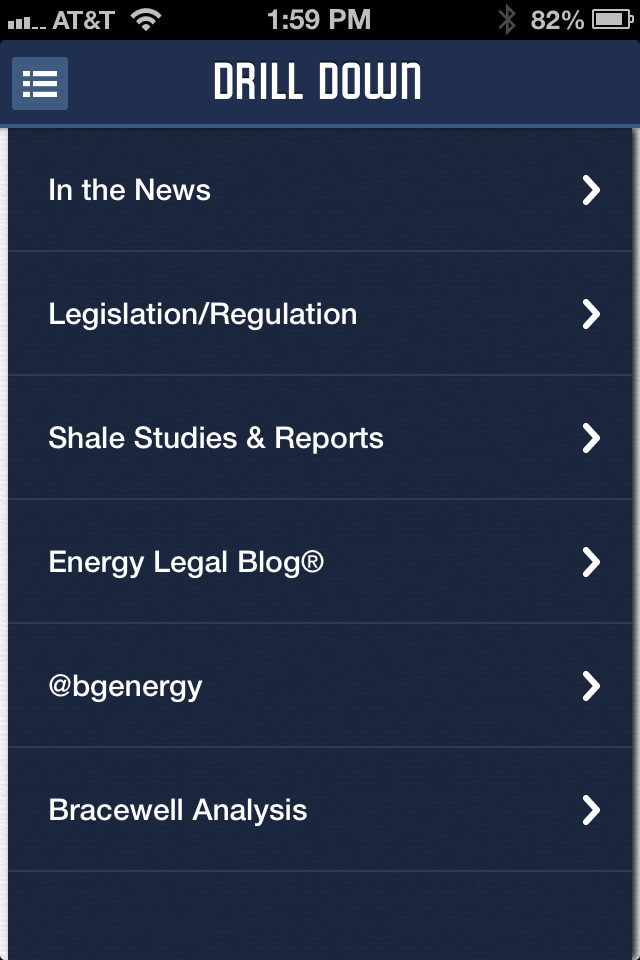
The ‘Drill Down ‘section contains news, information on legislation, studies, and analysis from the attorneys and energy professionals at Bracewell Giuliani.

Wheretoplayphoto

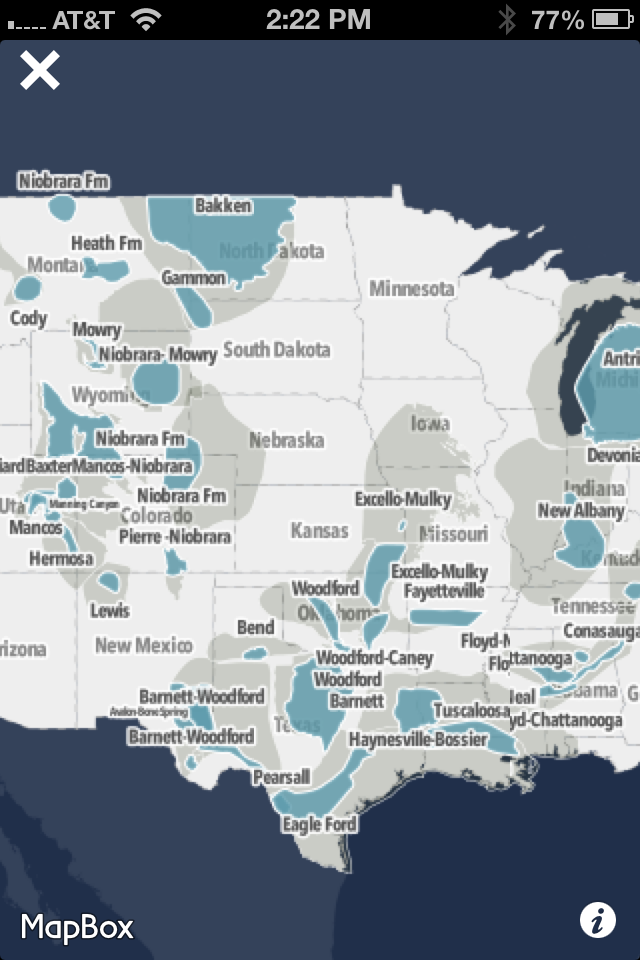
The ‘Where to Play’ section is an interactive map that allows the user to get information on a specific Shale Plays by just clicking on the map.  A single touch provides name and age  information on play.  In future versions of the program it would be nice to get more information, like rig count and drill permits.

Touching and holding a location on the map gives more information provides news from the State that the play is located in.  Hopefully future versions will provide more specific information for each play.  Right now, all plays within a state present the same news.

Howtoplayphoto

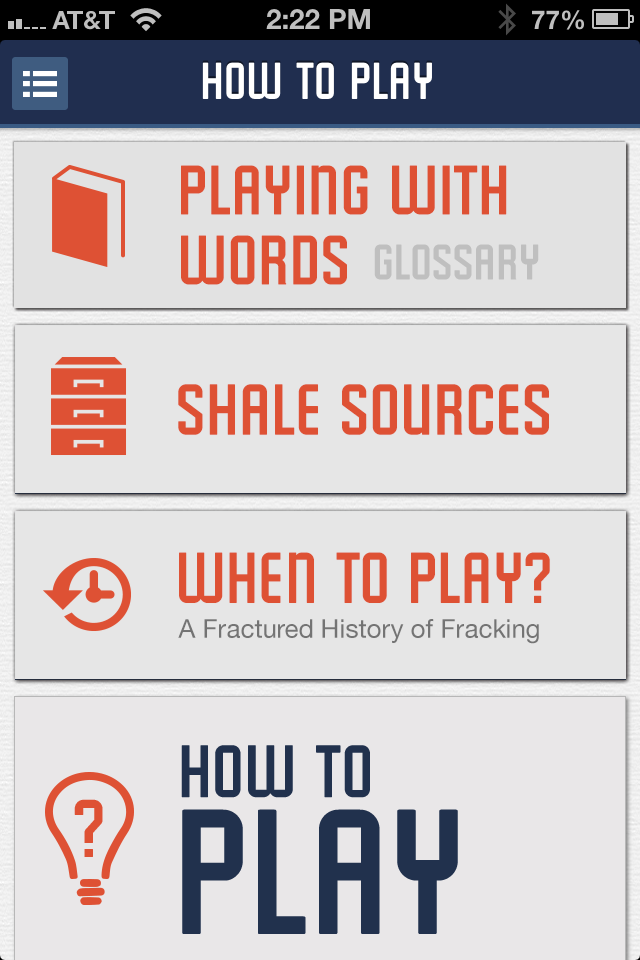
The ‘How to Play’ section provides informational and educational sources to learn more about the Shale industry.  There is a detailed glossary, listing of industry links and blogs, and a history of Fracking.  People new to the industry will most likely find this section very helpful.  Hopefully, this section will continue to grow as the app develops.

Upward mobility study suggest that Drake, Democrats, and Republicans are all wrong

Upward mobility, or the ability to move out of a lower income situation into the middle or top income class is a hot top in the U.S.  According to the New York Times, both political parties have argued recently that the odds of climbing the income ladder are lower today than in previous decades.

Drake, a popular rapper and hip hop artist, has a song, ‘Started from the Bottom’ , that (at least in spirit) embodies this debate.  His song, like the song’s title suggests, describes how he started at the bottom of the music industry and rose to the top over time.

A new study from the Equality of Opportunity Project finds that upward mobility has in fact not declined from previous decades like politicians suggest.  However, their study suggests that upward income mobility, unlike the experience of Drake, is difficulty for the average U.S. worker.  Overall, the author’s find that “…the [income] rungs of the [income] ladder have grown further apart (income inequality has increased), but children’s chances of climbing from lower to higher [income] rungs have not changed .”

The study’s authors, Raj Chetty, Nathaniel Hendren, Patrick Kline, Emmanuel Saez, and Nicholas Turner,  find that  contrary to popular perception, income mobility across generations have remained extremely stable for children born in the 1971-1993 time period.  For example, the authors find the probability that a child reaches the top fifth of the income distribution given that their parents were in the bottom fifth of the income distribution is 8.4% for children born in 1971, compared with 9.0% for those born in 1986.

Author’s find upward mobility chances have not changed over time

Their study, which is one of the largest in the nation, does however find that upward mobility in the U.S. is difficulty.  They find that upward mobility depends on a number of factors, such as geographical location, parent’s education, and family demographics.

For instance, the author’s study found that a person born into a San Jose, CA family that has income in the bottom 1/5 of workers  is 3x more likely than the same person born in Charlotte, NC to reach the top 1/5 of the income  distribution.

In short, the author’s study suggest that likelihood that the average person will rise from the bottom to the top, like the rapper Drake, may in fact be relatively small.

Side note: The project’s interactive data visualization tool is simply amazing. It allows you to see the impact of location on upward mobility probabilities by clicking on a map.

Union membership (11.3%) in 2013 about the same as in 2012 BLS reports

Union membership 1930-2012. Source: The Heritage Foundation

U.S. BLS reports that membership in unions was pretty much unchanged from 2012.  In 2013, 11.3% of wage and salary workers, or about 14.5 million workers, were in a union.  Highlights from the BLS data release include:

  • Public sector workers were more than 5 x more likely to be unionized.
  • Within the public sector, education, police, and firefighters had the highest level of unionization at over 35%
  • New York state had the highest level of unionization at over 24%
  • Union workers on average earned about $200 more per week than non-union workers ($950 v. $750)

LA Raiders sued in Alameda County for off-the-clock work and other alleged wage and hour violations

Numerous news sources reported on the wage and hour lawsuit filed by one LA Raider cheerleader against the team for allegedly violating California state wage and hour laws.

Read the complaint here.

KQED (Northern area Public Radio) reports:

A member of the Oakland Raiderettes cheerleading squad sued the football team in Alameda County Superior Court on Wednesday, alleging that the club is in “flagrant violation” of an array of California wage and employment laws.

[The lawsuit]  claims the Oakland Raiders club doesn’t pay the cheerleaders for all the time they spend working, withholds pay until the end of the season, and forces them to pay some of their own business expenses.


The lawsuit seeks to be certified as a class action on behalf of all present and former Raiderettes who cheered for the team since 2010.

[according to the complaint] the cheerleaders are paid only $1,250 per season, which amounts to less than $5 per hour for the time they spend rehearsing, performing and making required appearances at charity events.


Economists wrestle with age old question: should the minimum wage be increased?

Against:

Raising the wage will make it more expensive to hire younger and low-skill workers. There are better ways to help the poor. Expanding the earned income tax credit is a much more efficient way to fight poverty than increasing the minimum wage. (Kevin Hasett and Mark Strain)

http://www.aei.org/article/economics/fiscal-policy/labor/why-we-shouldnt-raise-the-minimum-wage/


Inflation is simply nowhere to be found in the U.S. economy

The latest data from the BLS further confirms the low level of inflation in the U.S.  A number of notable items that make up a large percentage of the CPI actually declined in 2013.  Motor fuel (which has a weight of 5.68 out of 100) in the CPI declined 1.0%, Household furnishings (3.2) fell 2.2%.  Medical equipment, non prescription drug prices, and recreational supplies (like sporting goods).  The average price of DVDs fell nearly 10% last year.


Economist, Justin Wolfers provides a light, but informative closer look at the recent CPI numbers and cookie versus cupcake inflation:

New (to me) STATA tool to use Fed Reserve data online

The FRED repository at http://research.stlouisfed.org/fred2/ contains over 3,000 U.S. economic time series. Each time series is stored in a separate file that also contains a string-date variable and header with information about the series. freduse imports a list of series into a single Stata dataset. This routine will be documented in an upcoming issue of the Stata Journal.

FREDUSE: Stata module to Import FRED (Federal Reserve Economic Database) data

Four plus one take-aways from 12/12/2014 Houston OFCCP Presentation

1. Impact Ratio Analysis (IRA) is still important to the OFCCP’s workforce analyses.  The 80% rule is still a tool.  However, the current compliance manual requires that a more holistic approach using statistical analysis and the calculation of standard deviations, be used in the final analysis and during the investigation.

2. Ethnic and sub group analysis is becoming more and more important.  The diversification of the U.S. workforce is creating a situation where smaller racial or ethnic groups are now large enough to study (2% rule)

3. Pre-Employment background checks can be used with care.  Employers should ensure that criminal history checks are germane and relevant to the jobs at issue.  Guidance on credit history checks is expected in the coming months.

4. Military Vet. goals and more guidance are expected in March 2014.  Some guidance was provided in 2013.

 Plus one take away…

It is amazing how far and wide the concepts of statistical significance have traveled over the last 20 years.  The OFCCP compliance officers were conversant in the concepts as well as small and large sample ratio statistical tests.  20 years ago these concepts were just making there way out for public consumption.

Using Healthcare.gov to evaluate fringe benefits loss allegations in litigation

The existence of insurance through healthcare.gov can impact the valuation of employer fringe benefits in a number of situations.

For instance, self-employed workers or business owners may be involved in lawsuits involving the loss of premium payments.  The healthcare.gov marketplace provides a means to compare the different insurance options available to the self employed or business owner involved in the lawsuit.  Prior to healthcare.gov, it was relatively cumbersome to gather the necessary information.  Now comparisons of premiums, coverages, and standard deductions can be made for multiple policies.