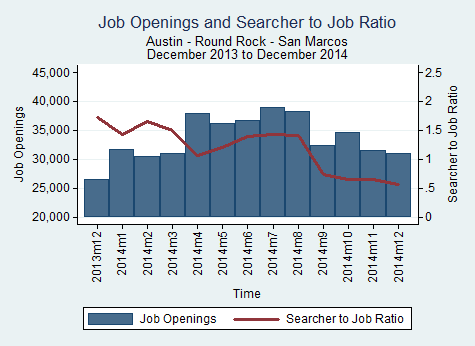
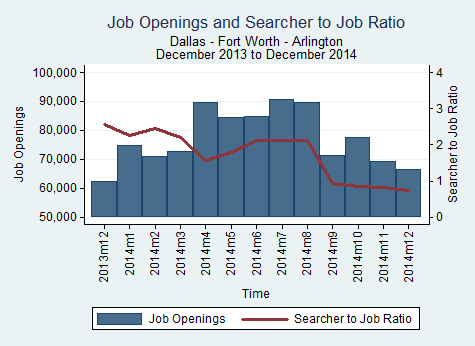
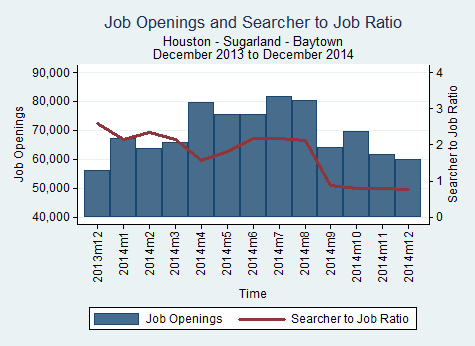
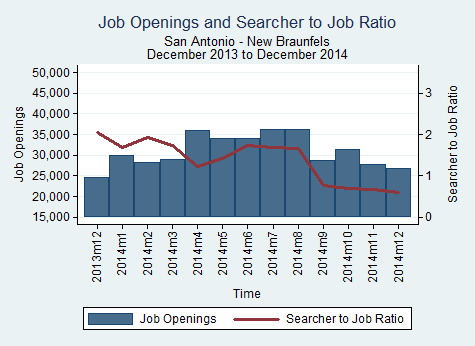
Compared to December of last year, all of the main MSAs (metropolitan statistical areas) in Texas saw an annual increase in the number of job openings and decrease in the searcher-to-job opening ratio.
Source: BLS
Compared to December of last year, all of the main MSAs (metropolitan statistical areas) in Texas saw an annual increase in the number of job openings and decrease in the searcher-to-job opening ratio.
Source: BLS
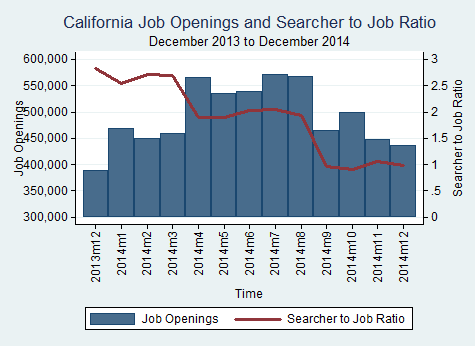
The number of job openings in California decreased from 447,277 in November 2014 to 436,019 in December 2014. The median number of job searchers per job opening across all MSAs (metropolitan statistical areas) and occupations in California was 1.06 in November 2014 and 0.98 in December 2014.
 Source: BLS
In this post, we look at the weekly overtime (OT) hours typically worked by those who work in Truck Transportation.
Many of the employees that work in these jobs are not exempt from FLSA overtime pay and earn 1.5 times pay for hours worked over 40 in a given week.
The tabulations below are based on U.S. BLS survey data. The BLS job title groups are insightful, generally containing more specific job titles with similar knowledge, skills, and abilities (KSA), but can be more broad than a particular company’s job title listing. Also, some companies may have the job title listed here as exempt from FLSA or state OT due to their specific job assignments. The BLS does not make a distinction as to if the job title is exempt or non-exempt from OT.
| Occupational Group Title | Percent of OT Workers | Average Hours of OT | 1 out of every 4 (25%) OT workers works at least: |
| Truck Transportation | 47.28% | 15 hours | 60 hours |
Source: BLS (CPS March)
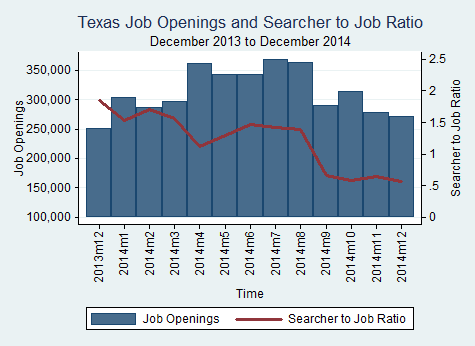
The number of job openings in Texas decreased from 278,989 in November 2014 to 270,849 in December 2014. The median number of job searchers per job opening across all MSAs (metropolitan statistical areas) and occupations in Texas was 0.64 in November 2014 and 0.56 in December 2014.
Source: BLS
Texas both experienced a greater increase in job openings than CA and US for the month of November.
November 2014
| State | Total Openings | Monthly Change | Yearly Change |
| CA | 447,277 | -10.45% | 15.15% |
| TX | 278,989 | -11.11% | 10.78% |
| USA | 3,530,115 | -10.69% | 13.44% |
Source: BLS
California experienced a decrease of 1,271 innovation job openings from October 2014 to November 2014, a decrease of 4.95%. Texas experienced a decrease of 820 innovation job openings from October 2014 to November 2014, a decrease of 39.48%.

| State | Total Openings | Monthly Change | Yearly Change |
| CA | 24,404 | -4.95% | 40.40% |
| TX | 12,748 | -6.05% | 39.48% |
Innovation jobs definition: http://www.employstats.com/blog/2014/09/26/1233/
Source: BLS
Image source: http://www.bizjournals.com/sacramento/news/2013/09/23/symposium-innovation-ecosystems-jobs-wea.html
California experienced a decrease of 5,307 innovation job openings from October 2014 to November 2014, a decrease of 7.42%. Texas experienced a decrease of 3,813 innovation job openings from October 2014 to November 2014, a decrease of 8.77%.
Our definition of STEM jobs: http://www.employstats.com/blog/2014/09/19/growing-national-interest-in-stem-fields-has-focused-our-research/
![]()
| State | Total Openings | Monthly Change | Yearly Change |
| CA | 66,268 | -7.42% | 34.89% |
| TX | 39,659 | -8.77% | 32.30% |
Source: BLS
Image source: http://projecttomorrowblog.blogspot.com/2013/11/i-am-scientist.html
All 4 of the largest MSAs (metropolitan statistical areas) in California experienced a decrease in job openings for the month of November.
Los Angeles-Long Beach-Santa Ana
The Los Angeles-Long Beach-Santa Ana MSA experienced a decrease of 13,475 job openings in November 2014, a -11.08% change from October 2014.
| Month | Total Openings | Percent Monthly Change | Percent Yearly Change |
| Dec-13 | 94,076 | -5.48 | 14.93 |
| Jan-14 | 113,912 | 21.09 | 14.93 |
| Feb-14 | 108,563 | -4.7 | 14.93 |
| Mar-14 | 110,825 | 2.08 | 14.93 |
| Apr-14 | 137,352 | 23.94 | 14.93 |
| May-14 | 129,540 | -5.69 | 14.93 |
| Jun-14 | 129,782 | 0.19 | 14.93 |
| Jul-14 | 137,333 | 5.82 | 14.93 |
| Aug-14 | 136,939 | -0.29 | 14.93 |
| Sep-14 | 112,657 | -17.73 | 14.93 |
| Oct-14 | 121,598 | 7.94 | 14.93 |
| Nov-14 | 108,123 | -11.08 | 14.93 |
San Francisco-Oakland-Fremont
The San Francisco-Oakland-Fremont MSA experienced a decrease of 6,125 job openings in November 2014, a -9.71% change from October 2014.
| Month | Total Openings | Percent Monthly Change | Percent Yearly Change |
| Dec-13 | 47,699 | -5.64 | 19.37 |
| Jan-14 | 57,523 | 20.59 | 19.37 |
| Feb-14 | 55,345 | -3.79 | 19.37 |
| Mar-14 | 56,460 | 2.01 | 19.37 |
| Apr-14 | 69,647 | 23.36 | 19.37 |
| May-14 | 65,783 | -5.55 | 19.37 |
| Jun-14 | 66,213 | 0.65 | 19.37 |
| Jul-14 | 69,790 | 5.4 | 19.37 |
| Aug-14 | 69,209 | -0.83 | 19.37 |
| Sep-14 | 58,567 | -15.38 | 19.37 |
| Oct-14 | 63,065 | 7.68 | 19.37 |
| Nov-14 | 56,940 | -9.71 | 19.37 |
Riverside-San Bernardino-Ontario
The Riverside-San Bernardino-Ontario MSA experienced a decrease of 4,732 job openings in November 2014, a -11.04% change from October 2014.
| Month | Total Openings | Percent Monthly Change | Percent Yearly Change |
| Dec-13 | 35,578 | -5.81 | 7.2 |
| Jan-14 | 42,940 | 20.69 | 7.2 |
| Feb-14 | 40,977 | -4.57 | 7.2 |
| Mar-14 | 41,811 | 2.03 | 7.2 |
| Apr-14 | 51,583 | 23.37 | 7.2 |
| May-14 | 48,935 | -5.13 | 7.2 |
| Jun-14 | 49,141 | 0.42 | 7.2 |
| Jul-14 | 52,360 | 6.55 | 7.2 |
| Aug-14 | 51,924 | -0.83 | 7.2 |
| Sep-14 | 40,018 | -22.93 | 7.2 |
| Oct-14 | 42,870 | 7.13 | 7.2 |
| Nov-14 | 38,138 | -11.04 | 7.2 |
San Diego-Carlsbad-San Marcos
The San Diego-Carlsbad-San Marcos MSA experienced a decrease of 4,452 job openings in November 2014, a -10.02% change from October 2014.
| Month | Total Openings | Percent Monthly Change | Percent Yearly Change |
| Dec-13 | 33,336 | -5.72 | 19.86 |
| Jan-14 | 40,242 | 20.72 | 19.86 |
| Feb-14 | 38,895 | -3.35 | 19.86 |
| Mar-14 | 39,795 | 2.31 | 19.86 |
| Apr-14 | 48,989 | 23.1 | 19.86 |
| May-14 | 46,354 | -5.38 | 19.86 |
| Jun-14 | 46,681 | 0.71 | 19.86 |
| Jul-14 | 49,258 | 5.52 | 19.86 |
| Aug-14 | 49,007 | -0.51 | 19.86 |
| Sep-14 | 41,343 | -15.64 | 19.86 |
| Oct-14 | 44,408 | 7.41 | 19.86 |
| Nov-14 | 39,956 | -10.02 | 19.86 |
Source: BLS
All four largest MSAs (metropolitan statistical areas) in Texas experienced a decrease in job openings from October 2014 November 2014.
Dallas
Dallas experienced a decrease of 8,344 job openings from October 2014 to November 2014, a 10.74% decrease.
| Date | Total Openings | Monthly Change | Yearly Change |
| Nov-14 | 69,326 | -10.74% | 11.28% |
| Oct-14 | 77,670 | 8.74% | 19.49% |
| Sep-14 | 71,430 | -20.43% | -6.57% |
| Aug-14 | 89,770 | -0.90% | 27.29% |
| Jul-14 | 90,586 | 6.86% | 28.67% |
| Jun-14 | 84,771 | 0.29% | 15.23% |
| May-14 | 84,526 | -5.64% | 20.19% |
| Apr-14 | 89,581 | 23.25% | 26.62% |
| Mar-14 | 72,682 | 2.48% | -2.52% |
| Feb-14 | 70,922 | -5.29% | 1.27% |
| Jan-14 | 74,887 | 20.21% | 12.54% |
| Dec-13 | 62,296 | -4.16% | -8.80% |
Austin
Austin experienced a decrease of 3,131 job openings from October 2014 to November 2014, a 9.03% decrease.
| Date | Total Openings | Monthly Change | Yearly Change |
| Nov-14 | 31,539 | -9.03% | 18.96% |
| Oct-14 | 34,670 | 7.17% | 24.53% |
| Sep-14 | 32,352 | -15.59% | -0.45% |
| Aug-14 | 38,327 | -1.57% | 28.78% |
| Jul-14 | 38,938 | 5.96% | 28.50% |
| Jun-14 | 36,748 | 1.44% | 15.98% |
| May-14 | 36,228 | -4.59% | 19.27% |
| Apr-14 | 37,971 | 22.48% | 25.01% |
| Mar-14 | 31,001 | 1.83% | -3.11% |
| Feb-14 | 30,443 | -3.77% | 0.38% |
| Jan-14 | 31,635 | 19.32% | 9.52% |
| Dec-13 | 26,512 | -4.77% | -10.09% |
Houston
Houston experienced a decrease of 16,301 job openings from October 2014 to November 2014, a 20.30% decrease.
| Date | Total Openings | Monthly Change | Yearly Change |
| Nov-14 | 61,824 | -11.15% | 10.35% |
| Oct-14 | 69,582 | 8.73% | 19.68% |
| Sep-14 | 63,998 | -20.30% | -5.99% |
| Aug-14 | 80,299 | -1.83% | 27.86% |
| Jul-14 | 81,792 | 8.29% | 29.66% |
| Jun-14 | 75,527 | -0.09% | 14.68% |
| May-14 | 75,596 | -5.17% | 20.16% |
| Apr-14 | 79,716 | 20.94% | 26.09% |
| Mar-14 | 65,912 | 3.59% | -1.16% |
| Feb-14 | 63,626 | -5.45% | 2.27% |
| Jan-14 | 67,291 | 20.11% | 12.98% |
| Dec-13 | 56,026 | -3.63% | -8.46% |
San Antonio
San Antonio experienced an increase of 7,402 job openings from October 2014 to November 2014, a 20.44% decrease.
| Date | Total Openings | Monthly Change | Yearly Change |
| Nov-14 | 27,676 | -11.80% | 12.69% |
| Oct-14 | 31,377 | 8.93% | 21.21% |
| Sep-14 | 28,805 | -20.44% | -4.98% |
| Aug-14 | 36,207 | 0.12% | 27.65% |
| Jul-14 | 36,164 | 6.00% | 27.85% |
| Jun-14 | 34,117 | 0.26% | 15.48% |
| May-14 | 34,029 | -5.52% | 20.28% |
| Apr-14 | 36,017 | 23.93% | 26.62% |
| Mar-14 | 29,061 | 2.62% | -2.85% |
| Feb-14 | 28,320 | -5.47% | 0.33% |
| Jan-14 | 29,958 | 21.97% | 12.89% |
| Dec-13 | 24,561 | -5.12% | -8.66% |
Source: BLS
California
California experienced a decrease of 52,217 job openings from October 2014 to November 2014, a 10.45% monthly decrease.
| Month | Total_Openings | Monthly_Change | Yearly_Change |
| Nov-14 | 447,277 | -10.45% | 15.15% |
| Oct-14 | 499,494 | 7.47% | 21.56% |
| Sep-14 | 464,759 | -18.01% | -2.91% |
| Aug-14 | 566,834 | -0.67% | 27.78% |
| Jul-14 | 570,648 | 6.01% | 27.68% |
| Jun-14 | 538,310 | 0.55% | 16.09% |
| May-14 | 535,368 | -5.24% | 20.85% |
| Apr-14 | 565,001 | 23.20% | 26.68% |
| Mar-14 | 458,591 | 2.14% | -2.59% |
| Feb-14 | 448,997 | -4.13% | 0.79% |
| Jan-14 | 468,361 | 20.57% | 11.64% |
| Dec-13 | 388,443 | -5.47% | -9.36% |
Texas
Texas experienced a decrease of 34,884 job openings from October 2014 to November 2014, an 11.11% monthly decrease.
| Date | Total_Openings | Monthly_Change | Yearly_Change |
| Nov-14 | 278,989 | -11.11% | 10.78% |
| Oct-14 | 313,873 | 8.34% | 19.17% |
| Sep-14 | 289,703 | -20.46% | -5.86% |
| Aug-14 | 364,236 | -1.23% | 27.59% |
| Jul-14 | 368,784 | 7.36% | 28.75% |
| Jun-14 | 343,517 | 0.21% | 14.99% |
| May-14 | 342,800 | -5.20% | 20.03% |
| Apr-14 | 361,597 | 22.06% | 25.80% |
| Mar-14 | 296,241 | 3.08% | -1.95% |
| Feb-14 | 287,386 | -5.31% | 1.30% |
| Jan-14 | 303,498 | 20.51% | 12.47% |
| Dec-13 | 251,841 | -4.38% | -8.61% |
Source: BLS