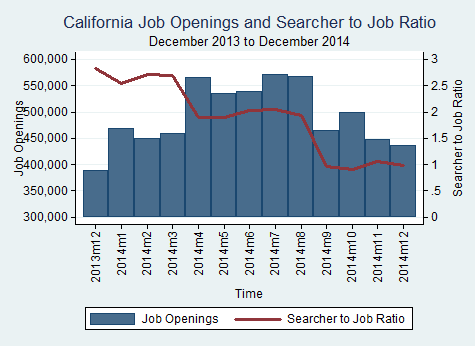
The number of job openings in California increased from 555,001 in March 2015 to 657,459 in April 2015. The median number of job searchers per job opening across all MSAs (metropolitan statistical areas) and occupations in California was 1.65 in March 2015 and 1.48 in April 2015.
Month: June 2015

Texas job openings by major occupational group for April
Total number of job openings and median searcher-to-job ratio across all MSAs (metropolitan statistical areas) for each major occupational group in Texas in April 2015.
Texas April 2015
| Occupation | Number of Openings | Searchers-to-Job Ratio |
| Installation, maintenance, and repair occupations | 20,665 | 0.46 |
| Transportation and material moving occupations | 22,804 | 0.46 |
| Sales and related occupations | 35,166 | 0.63 |
| Office and administrative support occupations | 63,846 | 0.71 |
| Management, business, and financial occupations | 66,443 | 0.81 |
| Farming, fishing, and forestry occupations | 1,138 | 0.82 |
| Service occupations | 76,080 | 1.06 |
| Construction and extraction occupations | 17,819 | 1.24 |
| Production occupations | 24,018 | 1.24 |
| Professional and related occupations | 96,547 | 1.28 |
Source: BLS
All four largest MSAs in Texas see annual increase in job openings for Apr
Compared to April of last year, all of the main MSAs (metropolitan statistical areas) in Texas saw an annual increase in the number of job openings and a decrease in the searcher-to-job opening ratio.
Source: BLS
Texas job openings increased from Mar to Apr
The number of job openings in Texas increased from 367,183 in March 2015 to 424,525 in April 2015. The median number of job searchers per job opening across all MSAs (metropolitan statistical areas) and occupations in Texas was 0.98 in March 2015 and 0.93 in April 2015.

Source: BLS
4 largest California MSAs see increase in job openings for April
All 4 of the largest MSAs (metropolitan statistical areas) in California experienced an increase in job openings for the month of April.
Los Angeles-Long Beach-Anaheim
The Los Angeles-Long Beach-Anaheim MSA experienced an increase of 26,029 job openings in April 2015, an 18.79% change from March 2015.
| Month | Total Openings | Percent Monthly Change | Percent Yearly Change |
| May-14 | 129,540 | -5.69 | 27.01 |
| Jun-14 | 129,782 | 0.19 | 27.01 |
| Jul-14 | 137,333 | 5.82 | 27.01 |
| Aug-14 | 136,939 | -0.29 | 27.01 |
| Sep-14 | 112,657 | -17.73 | 27.01 |
| Oct-14 | 121,598 | 7.94 | 27.01 |
| Nov-14 | 108,123 | -11.08 | 27.01 |
| Dec-14 | 104,302 | -3.53 | 27.01 |
| Jan-15 | 140,013 | 34.24 | 27.01 |
| Feb-15 | 137,967 | -1.46 | 27.01 |
| Mar-15 | 138,496 | 0.38 | 27.01 |
| Apr-15 | 164,525 | 18.79 | 27.01 |
San Francisco-Oakland-Fremont
The San Francisco-Oakland-Fremont MSA experienced an increase of 13,276 job openings in April 2015, an 18.65% change from March 2015.
| Month | Total Openings | Percent Monthly Change | Percent Yearly Change |
| May-14 | 65,783 | -5.55 | 28.41 |
| Jun-14 | 66,213 | 0.65 | 28.41 |
| Jul-14 | 69,790 | 5.4 | 28.41 |
| Aug-14 | 69,209 | -0.83 | 28.41 |
| Sep-14 | 58,567 | -15.38 | 28.41 |
| Oct-14 | 63,065 | 7.68 | 28.41 |
| Nov-14 | 56,940 | -9.71 | 28.41 |
| Dec-14 | 54,986 | -3.43 | 28.41 |
| Jan-15 | 72,089 | 31.11 | 28.41 |
| Feb-15 | 70,884 | -1.67 | 28.41 |
| Mar-15 | 71,196 | 0.44 | 28.41 |
| Apr-15 | 84,472 | 18.65 | 28.41 |
Riverside-San Bernardino-Ontario
The Riverside-San Bernardino-Ontario MSA experienced an increase of 9,550 job openings in April 2015, an 18.21% change from March 2015.
| Month | Total Openings | Percent Monthly Change | Percent Yearly Change |
| May-14 | 48,935 | -5.13 | 26.71 |
| Jun-14 | 49,141 | 0.42 | 26.71 |
| Jul-14 | 52,360 | 6.55 | 26.71 |
| Aug-14 | 51,924 | -0.83 | 26.71 |
| Sep-14 | 40,018 | -22.93 | 26.71 |
| Oct-14 | 42,870 | 7.13 | 26.71 |
| Nov-14 | 38,138 | -11.04 | 26.71 |
| Dec-14 | 37,377 | -2 | 26.71 |
| Jan-15 | 52,811 | 41.29 | 26.71 |
| Feb-15 | 52,141 | -1.27 | 26.71 |
| Mar-15 | 52,454 | 0.6 | 26.71 |
| Apr-15 | 62,004 | 18.21 | 26.71 |
San Diego-Carlsbad-San Marcos
The San Diego-Carlsbad-San Marcos MSA experienced an increase of 8,967 job openings in April 2015, an 18.38% change from March 2015.
| Month | Total Openings | Percent Monthly Change | Percent Yearly Change |
| May-14 | 46,354 | -5.38 | 24.58 |
| Jun-14 | 46,681 | 0.71 | 24.58 |
| Jul-14 | 49,258 | 5.52 | 24.58 |
| Aug-14 | 49,007 | -0.51 | 24.58 |
| Sep-14 | 41,343 | -15.64 | 24.58 |
| Oct-14 | 44,408 | 7.41 | 24.58 |
| Nov-14 | 39,956 | -10.02 | 24.58 |
| Dec-14 | 38,937 | -2.55 | 24.58 |
| Jan-15 | 49,272 | 26.54 | 24.58 |
| Feb-15 | 48,492 | -1.58 | 24.58 |
| Mar-15 | 48,782 | 0.6 | 24.58 |
| Apr-15 | 57,749 | 18.38 | 24.58 |
Source: BLS
4 Largest Texas MSAs see increase in job openings in April
All four largest MSAs (metropolitan statistical areas) in Texas experienced an increase in job openings from March 2015 to April 2015.
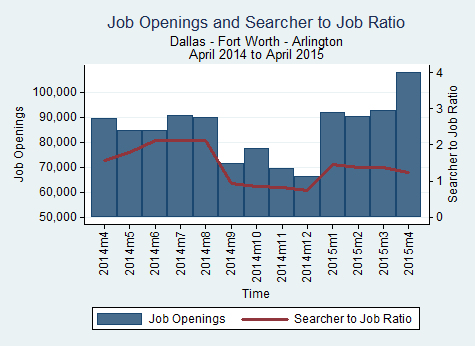
Dallas
Dallas experienced an increase of 17,455 job openings from March 2015 to April 2015, a 19.31% increase.
| Date | Total Openings | Monthly Change |
| Apr-15 | 107,841 | 19.31% |
| Mar-15 | 90,386 | 0.35% |
| Feb-15 | 90,072 | -1.85% |
| Jan-15 | 91,770 | 38.18% |
| Dec-14 | 66,413 | -4.20% |
| Nov-14 | 69,326 | -10.74% |
| Oct-14 | 77,670 | 8.74% |
| Sep-14 | 71,430 | -20.43% |
| Aug-14 | 89,770 | -0.90% |
| Jul-14 | 90,586 | 6.86% |
| Jun-14 | 84,771 | 0.29% |
| May-14 | 84,526 | -5.64% |
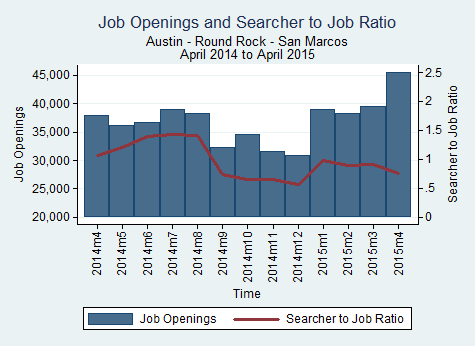
Austin experienced an increase of 6,936 job openings from March 2015 to April 2015, a 17.98% increase.
Austin
| Date | Total Openings | Monthly Change |
| Apr-15 | 45,514 | 17.98% |
| Mar-15 | 38,578 | 0.54% |
| Feb-15 | 38,372 | -1.78% |
| Jan-15 | 39,066 | 26.19% |
| Dec-14 | 30,957 | -1.84% |
| Nov-14 | 31,539 | -9.03% |
| Oct-14 | 34,670 | 7.17% |
| Sep-14 | 32,352 | -15.59% |
| Aug-14 | 38,327 | -1.57% |
| Jul-14 | 38,938 | 5.96% |
| Jun-14 | 36,748 | 1.44% |
| May-14 | 36,228 | -4.59% |
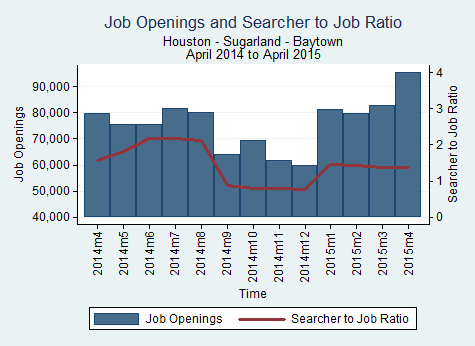
Houston experienced an increase of 15,005 job openings from March 2015 to April 2015, an 18.66% increase.
Houston
| Date | Total Openings | Monthly Change |
| Apr-15 | 95,434 | 18.66% |
| Mar-15 | 80,429 | 0.88% |
| Feb-15 | 79,730 | -2.12% |
| Jan-15 | 81,454 | 35.88% |
| Dec-14 | 59,945 | -3.04% |
| Nov-14 | 61,824 | -11.15% |
| Oct-14 | 69,582 | 8.73% |
| Sep-14 | 63,998 | -20.30% |
| Aug-14 | 80,299 | -1.83% |
| Jul-14 | 81,792 | 8.29% |
| Jun-14 | 75,527 | -0.09% |
| May-14 | 75,596 | -5.17% |
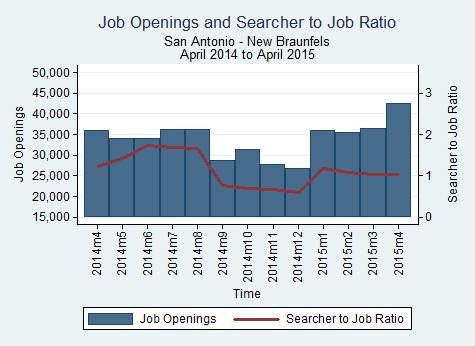
San Antonio experienced an increase of 6,798 job openings from March 2015 to April 2015, a 19.08% increase.
San Antonio
| Date | Total Openings | Monthly Change |
| Apr-15 | 42,425 | 19.08% |
| Mar-15 | 35,627 | 0.24% |
| Feb-15 | 35,543 | -1.08% |
| Jan-15 | 35,932 | 34.70% |
| Dec-14 | 26,676 | -3.61% |
| Nov-14 | 27,676 | -11.80% |
| Oct-14 | 31,377 | 8.93% |
| Sep-14 | 28,805 | -20.44% |
| Aug-14 | 36,207 | 0.12% |
| Jul-14 | 36,164 | 6.00% |
| Jun-14 | 34,117 | 0.26% |
| May-14 | 34,029 | -5.52% |
Source: BLS
California and Texas both saw increase in job openings in March
California
California experienced an increase of 2,579 job openings from February 2015 to March 2015, a 0.47% monthly increase.
| Month | Total Openings | Monthly Change | Yearly Change |
| Mar 15 | 555,001 | 0.47% | -1.77% |
| Feb 15 | 552,422 | -1.54% | 20.46% |
| Jan 15 | 561,081 | 28.68% | 24.96% |
| Dec 14 | 436,019 | -2.52% | -6.91% |
| Nov 14 | 447,277 | -10.45% | 15.15% |
| Oct 14 | 499,494 | 7.47% | 21.56% |
| Sep 14 | 464,759 | -18.01% | -2.91% |
| Aug 14 | 566,834 | -0.67% | 27.78% |
| Jul 14 | 570,648 | 6.01% | 27.68% |
| Jun 14 | 538,310 | 0.55% | 16.09% |
| May 14 | 535,368 | -5.24% | 20.85% |
Texas
Texas experienced an increase of 2,110 job openings from February 2015 to March 2015, a 0.59% monthly increase.
| Date | Total Openings | Monthly Change | Yearly Change |
| Mar 15 | 357,669 | 0.59% | -1.09% |
| Feb 15 | 355,559 | -1.76% | 20.02% |
| Jan 15 | 361,941 | 33.63% | 25.94% |
| Dec 14 | 270,849 | -2.92% | -10.76% |
| Nov 14 | 278,989 | -11.11% | 10.78% |
| Oct 14 | 313,873 | 8.34% | 19.17% |
| Sep 14 | 289,703 | -20.46% | -5.86% |
| Aug 14 | 364,236 | -1.23% | 27.59% |
| Jul 14 | 368,784 | 7.36% | 28.75% |
| Jun 14 | 343,517 | 0.21% | 14.99% |
| May 14 | 342,800 | -5.20% | 20.03% |
Source: BLS
Waiters and Waitresses experienced the largest increase of job openings nationwide for Mar
Waiters and Waitresses experienced the largest increase of new openings of all occupations in the US for the month of March with 4,538 new job openings.
March 2015
| Occupation | Total Openings | New Openings |
| Waiters and Waitresses | 62,102 | 4,538 |
Source: BLS
Top 3 occupations with the most new job openings in California for Apr
The top three occupations with the most new job openings in California for the month of April were Cashiers with 1,490 new openings, Secretaries and Administrative Assistants with 1,623 new openings, and Managers, All Other with 1,787 new openings.
April 2015
| Occupation | Total Openings | New Openings |
| Cashiers | 10,589 | 1,490 |
| Secretaries and Administrative Assistants | 9,466 | 1,623 |
| Managers, All Other | 12,409 | 1,787 |
Source: BLS
Top 3 occupations with the most new job openings in Texas for Apr
The top three occupations with the most new job openings in Texas for the month of April were Driver/Sales Workers and Truck Drivers with 1,043 new openings, Secretaries and Administrative Assistants with 1,047 new openings, and Elementary and Middle School Teachers with 1,130 new openings.
April 2015
| Occupation | Total Openings | New Openings |
| Driver/Sales Workers and Truck Drivers | 7,031 | 1,043 |
| Secretaries and Administrative Assistants | 6,299 | 1,047 |
| Elementary and Middle School Teachers | 4,564 | 1,130 |
Source: BLS