Author: Dwight Steward, Ph.D.
Economic modeling of business profit losses in a breach of contract case
 Modeling business profit losses
As discussed in a previous post, the plaintiff in this case is suing their landlord for breach of contract. The plaintiff alleges that the defendant landlord misrepresented the terms of the contract, specifically regarding how the property that they were leasing could be used.
At the heart of the issue, the plaintiff alleges that the defendant represented that they would be able to operate a live music venue restaurant from the location. The plaintiff alleges that the defendant’s failure to support the permitting and rezoning efforts constituted a breach of contract.
The premise lease was for 10 years. The plaintiff operated the live music for two years. In year three, since the facility did not have the proper permits, the facility operated as a restaurant that also provided catering and was also a destination for weddings and other events. The defendant terminated the lease after 3 years.
So how are damages analysed?
In this case there are three distinct types of damages: lost out-of-pocket expenses, lost profits from the termination of the premise lease, and lost expected profits from the performance of the contract. In this case, the three different types of damages are distinct.
Lost out-of-pocket expenses:
These are the expenses that the plaintiff expended on services and products, such remodeling the interior, architects, construction etc., but was not allowed to use because of the defendants actions.
The total cost of some items such as the cost of professionals hired to complete the re-zoning applications, is included in the analysis. In other situations, the un-used portion is relevant. For instance, the plaintiff constructed special performance stages and purchased sound equipment for the outside music performance, which they were able to use for three years. In these instances, the value of the use that the plaintiff received needs to be deducted, along with any salvage value, from the plaintiff’s cost.
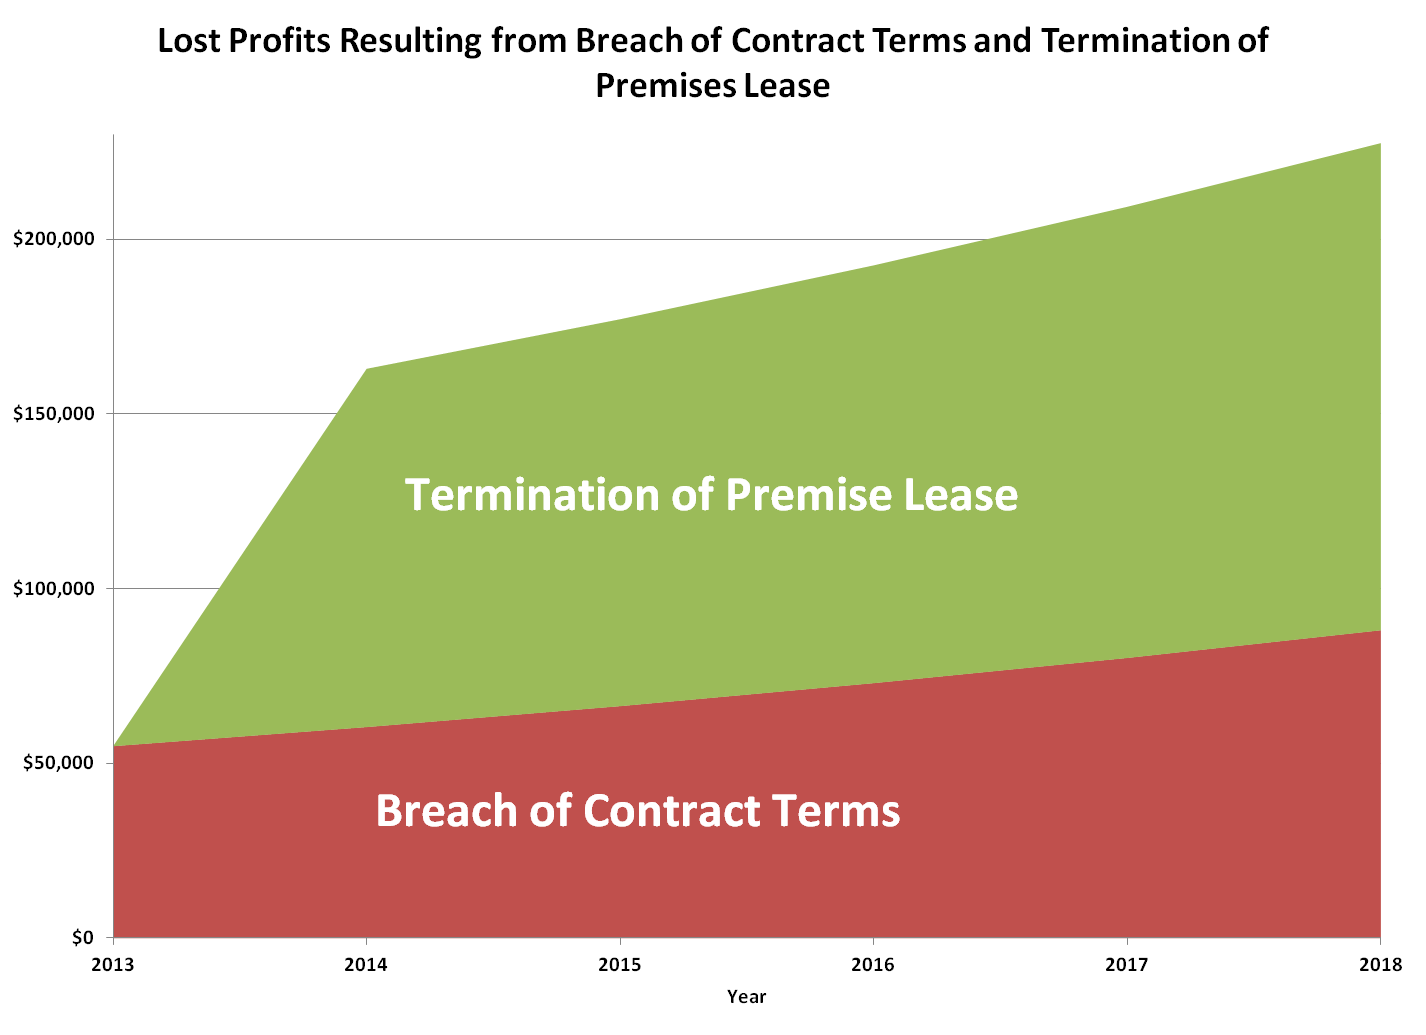
Lost profits from the termination of the premise lease:
In this case, these are the losses associated with having to operate at a lower capacity. It will in essence be the difference between the profits that the plaintiff could have continued to earn had they continued to operate as a restaurant without the live music venue (‘but-for’ reduced operating earnings) and what they actually earned ($0) from the business following the termination of the lease. In this case, the plaintiff actually could, and did, operate the facility as a restaurant and wedding reception facility. The earnings and profits from year three, the time period that the business operated as a restaurant and special events facillity only, is used as a benchmark for the reduced operating capacity ‘but-for’ profits projections. The business shut down after the lease ended so the actual earnings are $0.
Lost expected profits from full performance of the contract:
These are the alleged lost profits associated with the revenue that the business would have earned had the defendant fully performed the contract and performed the necessary steps for the plaintiff to operate the live music venue on the leased premise.
The lost expected profits are calculated as the difference between the ‘but-for’ profits that the plaintiff would have earned had the defendant fully performed the contract and the business was allowed to operate as a live music venue and the profits that the plaintiff could have earned had they continued to operate the business in its reduced capacity as a restaurant-special events facility only. In this instance, the revenue from the two year time period is used to provide the benchmark for the ‘but-for’ and full contract performance profits.
Breakdown of Customer’s Credit Card Use in a Small Business
Credit cards and debit cards are the way of the world now; it is how we pay for nearly everything we buy now.
One question that comes up for retail businesses is: Does the type of credit card tell us anything about the customer?
For example, do AMEX users tend to be bigger spenders? The answer of course depends on the business. The table below shows the average sale and percentage of monthly sales made by customers of a small restaurant broken down by the type of credit/debit card used.
| Average Amount of Sale | Percentage of Monthly Sales | |
| AMEX | $ 21.88 | 3% |
| VISA | $ 19.46 | 73% |
| MC | $ 21.00 | 22% |
| DISCOVER | $ 22.19 | 2% |
For this business VISA is king. Moreover there is little difference in the size of the average bill of the different types of credit/debit card users.
Three takeaways from a closer look at job openings data for March 2014
 The Conference Board Help Wanted Online (HWOL) data series release for March 2014 indicated a number trends worth discussing.
The Conference Board Help Wanted OnLine® Data Series (HWOL) measures the number of new, first-time online jobs and jobs reposted from the previous month for over 16,000 Internet job boards, corporate boards and smaller job sites that serve niche markets and smaller geographic areas.
The Conference Board’s HWOL series measures help wanted advertising, i.e. labor demand. The HWOL data series began in May 2005. The HWOL provides seasonally adjusted data for the U.S., the nine Census regions and the 50 States. The HWOL also provides seasonally adjusted data for occupations and for the 52 largest metropolitan areas..
So what are the trends. Three take aways
- Shale drilling influences remain high. The state of North Dakota, which has a very active Shale play, had one of the lowest supply to demand ratios (S/D ratio) of 0.46. That is there were over 2 jobs advertised for each available worker. Texas and the metro areas in Texas also had high employer demand.
- California economy is growing again but in spurts. Some metro areas in California such as San Jose had a very high employer demand (1.31 S/D ratio) while others like Riverside had a lot of searchers per job opeing (5.15)
- STEM rules. Computer, math, and engineering jobs are in high demand. The HWOL data shows that many of these occupations have S/D ratios of less than one
Who is practicing law in Harris County, Texas courts? A look at the distribution of law schools of attorneys with cases in Harris County
Who is practicing law in Harris County, Texas courts? A look at the distribution of law schools of attorneys with cases in Harris County. The table below shows the breakdown for attorneys with business and injury related cases files in the first week of June 2013. Not surprisingly, South Texas, Univ. of Houston, and Univ. of Texas have the highest representation.
| schoolattended | Freq. | Percent | Cum. | ||
| Baylor University | 10 | 6.02 | 6.02 | ||
| Cornell University | 1 | 0.60 | 6.63 | ||
| Franklin Pierce Law Center | 1 | 0.60 | 7.23 | ||
| Golden Gate University | 1 | 0.60 | 7.83 | ||
| Louisiana State University | 1 | 0.60 | 8.43 | ||
| Loyola Law School Los Angeles | 1 | 0.60 | 9.04 | ||
| Pepperdine School Of Law | 2 | 1.20 | 10.24 | ||
| Regent University | 1 | 0.60 | 10.84 | ||
| Seton Hall University | 1 | 0.60 | 11.45 | ||
| South Texas College Of Law | 50 | 30.12 | 41.57 | ||
| Southern Methodist University | 8 | 4.82 | 46.39 | ||
| St. Mary’s University | 5 | 3.01 | 49.40 | ||
| Texas Southern University | 5 | 3.01 | 52.41 | ||
| Texas Tech University | 5 | 3.01 | 55.42 | ||
| Tulane University | 5 | 3.01 | 58.43 | ||
| University Of Baltimore | 1 | 0.60 | 59.04 | ||
| University Of Cincinnati | 1 | 0.60 | 59.64 | ||
| University Of Hawaii | 1 | 0.60 | 60.24 | ||
| University Of Houston | 23 | 13.86 | 74.10 | ||
| University Of Michigan | 1 | 0.60 | 74.70 | ||
| University Of Oklahoma | 1 | 0.60 | 75.30 | ||
| University Of Tennessee | 1 | 0.60 | 75.90 | ||
| University Of Texas | 29 | 17.47 | 93.37 | ||
| University Of Tulsa | 1 | 0.60 | 93.98 | ||
| University Of Virginia | 2 | 1.20 | 95.18 | ||
| Unknown | 5 | 3.01 | 98.19 | ||
| Vanderbilt University | 1 | 0.60 | 98.80 | ||
| Washington University | 1 | 0.60 | 99.40 | ||
| Widener University School Of L | 1 | 0.60 | 100.00 | ||
| Total | 166 | 100.00 |
U.S. BLS data provides a closer look at what 27 year olds are doing today at work, school, and home
 The U.S. BLS released some interesting statistics on what people born in the early 1980’s are doing today in the labor market, school, and at home. The findings are from the National Longitudinal Survey of Youth 1997, a nationally representative survey of about 9,000 young men and women who were born during the years 1980 to 1984
Here are some of the major findings.
•Women have more education: By 27 years of age, 32 percent of women had received a bachelor’s degree, compared with 24 percent of men. Nine percent of men were high school dropouts compared to 8 percent of women.
•Everybody changes jobs a lot!. Individuals born from 1980 to 1984 held an average of 6.2 jobs from ages 18 to 26. The
number of jobs held varies by education for women but not for men.
•Those without HS have a hard time getting a job. High school graduates who had never enrolled in college were employed an average of 68 percent of the weeks from ages 18 to 22, and 74 percent of weeks from ages 23 to 26. In comparison, those who had dropped out of high school were employed 51 percent of weeks from ages 18 to 22, and 57 percent of weeks from ages 23 to 26.
• Most are not married. Thirty-four percent of young adults were married at age 27, while 20 percent were cohabiting and 47 percent were single. On average, young adults with more education were more likely to be married and less likely to be cohabiting. Young adults who were single at age 27 were employed 70 percent of the weeks from ages 18 to26, compared to 77 percent of weeks for those who were married and 72 percent of weeks, for those who were cohabiting.
• The moms work outside of the home. Women with children in their household at age 27 were employed 65 percent of weeks from age 18 to 26 compared to 76 percent of weeks for women without children in their home. Conversely, men tended to work more weeks if they had children in the household than if they did not (79 percent of weeks versus 73 percent).
Work life cycle labor market model shows lifetime impact of Great Recession on earnings and wages
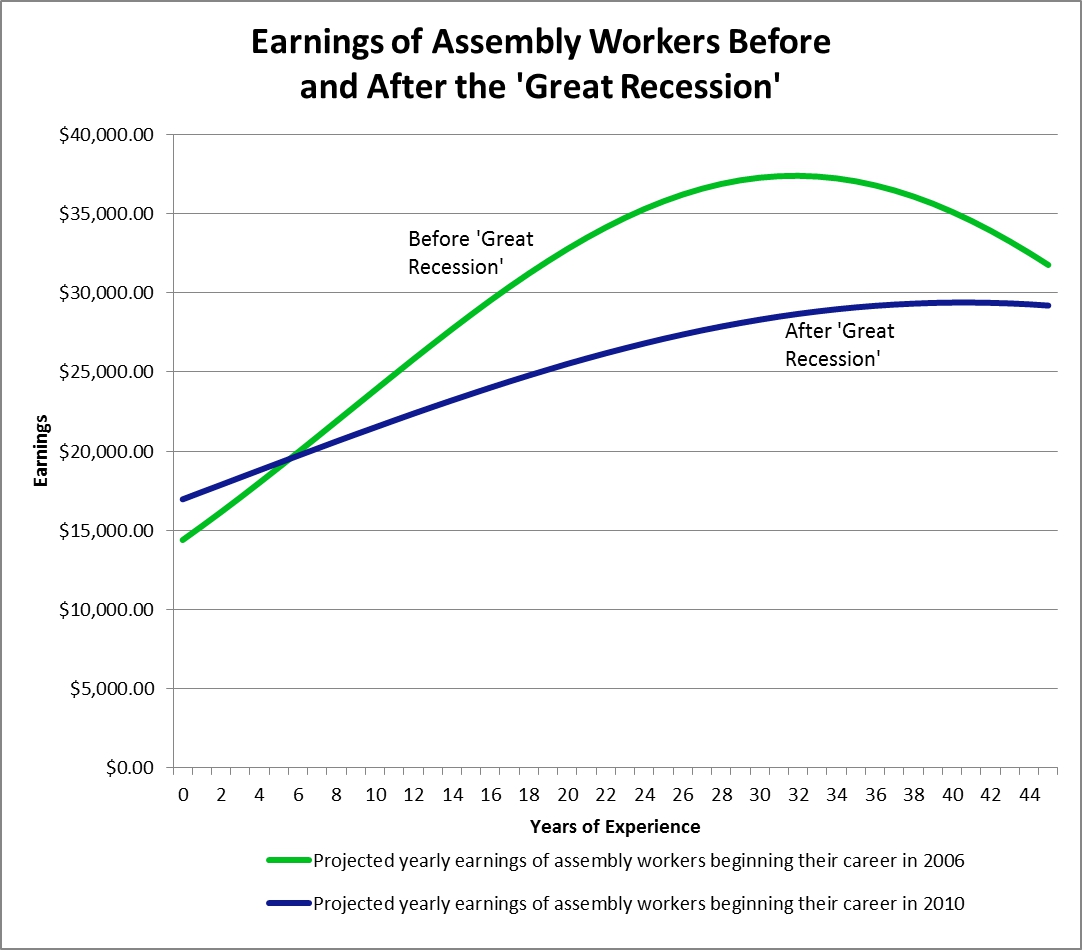
The graph above shows the expected lifetime earnings of a person working as a manufacturing assembler. The red line shows the earnings that a person who began working as a manufacturing assembler in 2006 could expect over their projected work life of approximately 44 years. The blue line shows the earnings that a person who began working as a manufacturing assembler in 2010 could expect over a projected work life of approximately 44 years. Both projected earnings streams account for projected inflation.
The work life earnings for manufacturing assemblers, projected using a life cycle labor market model, show that after the Great Recession these types of workers can expect both lower annual earnings and wage increases over their projected working life.
Methodology:
The projected earnings profiles are constructed from statistical models based on the Current Population Survey (CPS) labor market data from the U.S. Bureau of Labor Statistics (BLS). The earnings profiles for assembly workers are based on the earnings of high school educated white male assemblers and fabricators, working full-time or part-time, in 2006 and 2010.
Federal Reserve study finds no evidence that payday loans increase financial stress on borrowers

There has been a strong debate about the risks and benefits of payday loans for many years now. Some argue that payday loans are predatory and increase the stress on already strained borrowers. Others argue that payday loans serve as a crucial source of liquidity for individuals who would otherwise have no other alternatives. Academic research on this question has been generally inconclusive.
Neil Bhutta, an economist at the Federal Reserve Board in Washington, D.C. provides some new insights to this issue in his recent paper. Payday Loans and Consumer Financial Health. Overall, his research, which uses a novel data set and methodology, finds no evidence that payday loans increase delinquencies or financial stress on borrowers
Abstract (from paper):
In this paper, I draw on nationally representative panel data comprised of individual credit records, as well as Census data on the location of payday loan shops at the ZIP code level, to test whether payday loans affects consumers’ financial health, using credit scores and score
changes, as well as other credit record variables, as measures of financial health. In order to identify the effect of payday loans, I take advantage of geographic and temporal variation in
access arising from differences in state lending laws. In addition to standard identification strategies based on state law variation, I also follow Melzer’s (2011) novel strategy of exploiting within-state variation in access to payday loans due to differences in the proximity of ZIP codes in states that prohibit payday lending to states that allow payday lending.
Overall, I find little to no effect of access to payday loans on credit scores and other credit record outcomes. The results contrast with previous research…
Atlanta Fed President suggest that U.S. labor market has a ways to go before reach full employment; especially the shadow work force

Lockhart says to get close to full employment would involve substantial absorption of shadow labor force http://t.co/94EdTaNDd5
— Atlanta Fed (@AtlantaFed) March 6, 2014
The shadow labor market includes people who are still willing to work but have essentially stopped looking for work. The BLS provides some measure of this in its U-6 measure of unemployment.

As this graph shows, U6, which accounts for the shadow workers, runs at about 2x the rate of the official unemployment rate. The Atlanta Fed Pres. statements show particular concern for reabsorbing (or simply put, getting jobs for) these individuals into the workforce.
Thank you Oakland Wage and Hour lunch CLE attendees!

We would to thank each of you for coming out and participating! It was extremely nice to have both plaintiff and defense attorneys in attendance. The back and forth was wonderful.
Thanks:
Law Offices of Enrique Martinez
Law Offices of Patrick Kitchin
Mora Employment Law
Patton Wolan Carlise
Garcia & Gurney
And
The Ginn House, Preservation Park, Oakland, California for the facilities and the food service.