In a recent document and interview, GM has laid out its plan to compensate people injuried or those with familiy members who were killed due to product defects. The full plan can be found here. Some highlights are below.
Types of claims covered by plan:
1. Individual Death Claims
2. Category One Physical Injury Claims: claims involving quadriplegic injury,
paraplegic injury, double amputation, permanent brain damage requiring
continuous home medical assistance, or pervasive burns encompassing a
substantial part of the body.
3. Category Two Physical Injury Claims: claims, other than Category One
Physical Injury Claims, that, within 48 hours of the accident, require either
overnight hospitalization of one or more nights or, in extraordinary
circumstances as determined on a case by case basis by the Administrator,
outpatient medical treatment
METHODOLOGIES FOR CALCULATING COMPENSATION
1. Track A – Presumptive Compensation
The Track A presumed methodology relies upon a combination of the decedent’s
historical earnings and personal details with assumptions of likely future events based
upon multiple sources of publicly available national data including the Bureau of Labor
Statistics and the Internal Revenue Service. Eligible Claimants need not present detailed
computations or analyses
This Track A presumed methodology ensures consistent economic loss calculations for
similarly situated victims (i.e., same age, number of dependents and income level)
2. Track B – Complete Economic Analysis
Track B entails a complete, comprehensive economic loss analysis of the decedent’s past,
present and assumed future income. The Facility will consider the financial history of the
decedent through incorporation of submitted individual income data, including past,
present and future earnings, wage growth, work life expectancy, etc., as well as other
case-specific information and circumstances of the decedent that the claimant believes
the Facility should consider in determining the total value of the claim. I
Non-economic losses will also be determined as follows.
• $1,000,000 for the death of the decedent, and
• $ 300,000 for the surviving spouse, and
• $ 300,000 for each surviving dependent of the decedent.
In addition, life care plans to cover future medicals will also funded for injured individuals needing future care.
 The oil and gas extraction industry in Texas gained 2,500 jobs from April 2014 to May 2014. Compared to May 2013, the cumulative number of jobs added in this industry is 9,700, an increase of 9.4%.
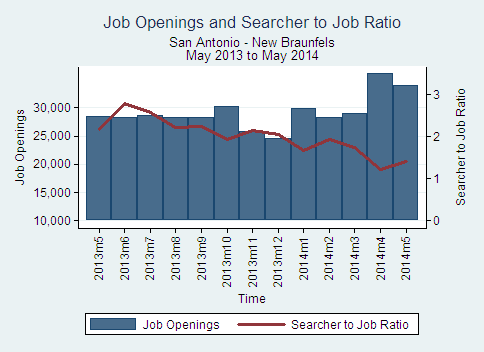
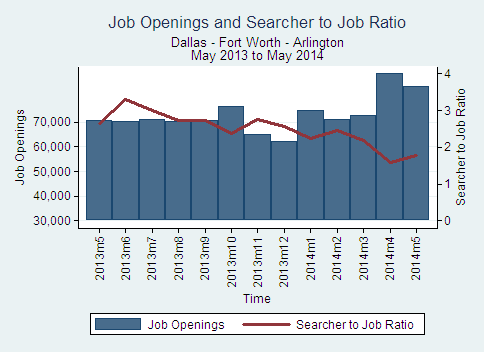

 Overview
 The number of job openings in Texas decreased from 361,597 in April 2014 to 342,800 in May 2014. The median number of job searchers per job opening across all MSAs (metropolitan statistical areas) and occupations in Texas was 1.12 in April 2014 and 1.29 in May 2014.
 In May 2014, VA launched the