EmployStats Welcomes Christian Adams

About Christian Adams

Christian received her B.B.A. in Banking and Financial Institutions from Sam Houston State University in August 2022. She began working as an intern this past Spring during her final semester. She enjoyed both her Econometrics for Business course and Intro to Python for Data Science course while also being a member of the International Economic Honors Society, Omicron Delta Epsilon.

Christian’s Favorites Include:

Hobbies:

  • Running
  • Playing the Diablo video games
  • Cooking

Types of Movies and Books:

  • MasterChef
  • True Crime

Favorite Foods:

  • Tex Mex
  • Seafood

Favorite Quote:

  • “An investment in knowledge pays the best interest.” – Benjamin Franklin

We are extremely thrilled to have Christian on our team. We offer our warmest welcome to our newest team member.

EmployStats Welcomes Ruth Robinson

About Ruth Robinson

Ruth received her Bachelor of Arts in Business Administration and Data Analytics from the University of Baltimore in June 2022. She began working as an intern this past Spring during her final semester. While in college she especially liked taking classes in her elective interests such as real estate and discrete mathematics. She also enjoyed her participation in the Astrobees club, where she competed in a NASA SUITS competition.  

Ruth’s Favorites Include:

Hobbies:

  • Reading
  • Playing Pool
  • Cooking

Types of Movies and Books:

  • Doctor Who
  • Survival and Sci Fi Shows

Favorite Foods:

  • Shrimp and Grits
  • Salmon

Favorite Quote:

  • “Our deepest fear is not that we are inadequate. Our deepest fear is that we are powerful beyond measure. It is our Light, not our Darkness, that most frightens us. We ask ourselves, who am I to be brilliant, gorgeous, talented, fabulous? Actually, who are you not to be? There is nothing enlightening about shrinking so that other people won’t feel unsure around you. We were born to shine, As children do, As we let our own Light shine, We consciously give other people permission to do the same. As we are liberated from our own fear, our presence automatically liberates others.”

We are extremely thrilled to have Ruth on our team. We offer our warmest welcome to our newest team member.

Gathering Data for Labor Market and Mitigation Studies

Performing labor market and mitigation studies requires gathering and using specific information. Often, this information pertains to the plaintiff’s job search efforts within the labor market. For example, did the individual apply for jobs that matched their expertise and education level. Additionally, if an application is made to a different job, we must determine if the job qualifications are similar to their previous position.

Labor market data sources such as, U.S. Bureau of Labor Statistics labor market survey (BLS) and U.S Department of Labor’s ONET, are often used to analyze an individual’s potential job matches.  It is through this type of research that an accurate picture of the plaintiff’s job search efforts can be measured and provide needed information in these types of labor market and mitigation studies.

For more information visit Employstats or contact us at info@employstats.com.

EmployStats Advises the EEOC on Collection of Survey Data

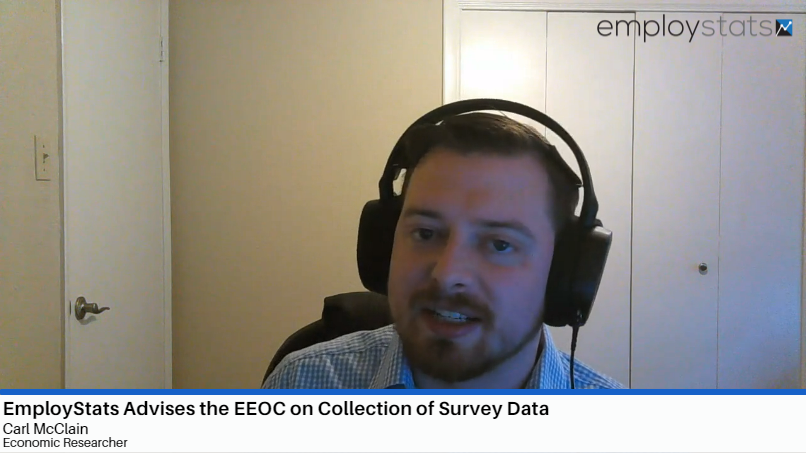
EmployStats was brought on to provide our feedback on the best uses of this EEOC-2 data. In these panel meetings, we testified about our industry level experience in using available pay data to analyze claims of disparate pay and employment discrimination. We described to the EEOC how companies like EmployStats, research institutions, and public users utilize federally maintained datasets in practice, comparing the survey data the EEOC collected to other federal databases like the Bureau of Labor Statistics (BLS).

We explained the benefits of current benchmark pay data from different public and private sources, and what additional value the EEO-2 survey data could bring. We also provided EEOC recommendations on best practices for the formatting and publication of the EEOC’s data, so this survey data can be of maximum utility to researchers and the general public. 

A few years ago the EEOC had created an additional component to their Equal Employment Opportunity (EEO) survey sent out to employers in the United States, known as Component 2 (EEOC-2 / EEO-2). This addition to their survey asked employers about the compensation of employees and their hours worked, organized by job category, gender, race, ethnicity, and certain pay bands. After collecting this data, the EEOC was interested in analyzing this data and determining how it could be best utilized by both the commission, and the public at large. Partnering with the National Academy of Sciences (NAS), the EEOC formed a panel to closely examine this compensation data, and collect input on its utilization. EmployStats was able to collaborate with several well known professionals including William Rogers, Elizabeth Hirsh, Jenifer Park, and Claudia Goldin

To discuss a potential case or to answer any questions, you can email info@employstats.com or contact us at 1-866-629-0011.

Making Wage and Hour Data Analysis Cost Effective

Making Wage and Hour Data Analysis Cost Effective

Calculating unpaid wages, penalties, and other potential wage and hour violations can be a costly endeavor. In some cases, many hours could be spent just getting the payroll and time data into a format that could be analyzed. There are a few things that can help lower time and cost of performing a wage and hour data analysis.


  • Understand the Time and Payroll Data Before You Start

Getting the employer to provide the background information for the underlying time and payroll data will help save time and money in the future.  

Knowing what the different payroll codes mean, how the time and payroll records fit together, the employer’s pay period end and start dates, and the types of bonuses that the employees earned can help streamline the data management and analysis process.


  • Computer Program Every Step of the Analysis

Use computer programs such as R, STATA, VBA or something similar to handle the data management and analysis. Writing computer code in these types of programs will make managing the time and payroll data and making adjustments to the analysis both easier and replicable.  


  • Establish Clear Objectives

Before you get started, be clear which types of wage and hour violations you need to study. This is particularly important when dealing with time punch data. A lot of time and energy can be saved on the front end by structuring the time and payroll data into a format that will make determining things, such as the hours worked, easier on the backend.


  • Context of Wage and Hour Analysis

After you establish the types of wage and hour violations, determine the type of violations–local, state or federal. Each type of violation may require different types of analysis.

Dr. Roberto Cavazos Discussing the Economic Impact of Pay-Per-click Fraud

Check out EmployStats very own Dr. Roberto Cavazos discussing several solutions designed to prevent PPC Fraud.

EmployStats economist Dr. Roberto Cavazos finds that economic loss from pay-per-click (PPC) is on the rise as fraudulent activity risks have increased as many large corporations use this platform. According to Dr. Cavazos, approximately $144 Billion is spent on paid and social search globally. However, according to empirical-based research, 14% of PPC was fraudulent making the economic loss to $23.7 Billion by the end of 2020.

What exactly is PPC fraud? According to bigcommercec.com, PPC fraud can be defined as individuals, computer programs, or generated scripts exploiting online advertisers by repeatedly clicking on a PPC advertisement to generate fraudulent charges. Dr. Cavazos stated there are several techniques used to perform these acts including competitor clicks, clicks by automated clicking tools, and robots or other deceptive software. To counteract these invalid clicks, Google is taking a proactive approach by automatically filtering any click that is considered invalid, however many clients find this safeguard to be a lot more complicated than beneficial.

Dr. Cavazos reported the economic loss that has amounted from PPC globally has made a substantial dent in the market. The total PPC fraud loss for the U.S. in 2019 was $7,700,000,000 and $9,060,800,000 in 2020. By the end of 2020, the expected loss for the largest eCommerce sector was $3.8 Billion on PPC campaigns. This was based on the 17% fraudulent clicks that were found across multiple eCommerce campaigns. Dr. Cavazos shared even though global web sales amounted to an astounding $3.4 trillion in 2019, the projected loss from PPC fraud is still a sizeable amount. Despite the global loss, paid search remains the most-used digital advertising format bringing in 47% of total digital revenues.

The rise of PPC platform spending has opened a new route for commitment of fraudulent activity. Each platform experiences their own issues with fraudulent activity making it difficult to recognize. Ending PPC fraud has become a top priority when it comes to enhancing and augmenting future campaigns. While PPC has been a successful marketing tactic, it poses risks for fraudulent behavior requiring an understanding of the consequence of the use of PPC and steps to be taken to minimize those risks. Dr. Cavazos believes these losses are borne by businesses making the smaller ones most vulnerable to suffering PPC fraud.

Research Associate Proma Paromita Participates in Stata Online Training Course

Our very own Research Associate Proma Paromita recently participated in an online training course for Stata. Stata is an integrated statistical software package that provides services for data manipulation, visualization, statistics, and automated reporting.

Here at EmployStats our researchers are always working with huge data sets that need to be analyzed and formatted. This course provided Proma with a better understanding of Stata programming and insight on how to more efficiently dissect large quantities of data.

In a sit-down interview Proma discussed her experience and general layout of the course. She explained the scaffolding of course content beginning with the basics and increasing with complexity as the course continued. Proma described the course as concise with practical examples resulting in a perfect tool to utilize for future Stata programming. Stata offers many resources on its website and YouTube channel to help individuals navigate challenges by accessing helpful information.

As a takeaway from the course Proma believes understanding the syntax is more beneficial than memorizing it. Additionally, she stressed it is essential to understand the data that you are working with in order to produce tangible results.

Data Mining and Litigation (Part 1)

Data Mining is one of the many buzzwords floating about in the data science ether, a noun high on enthusiasm, but typically low on specifics. It is often described as a cross between statistics, analytics, and machine learning (yet another buzzword). Data mining is not, as is often believed, a process that extracts data. It is more accurate to say that data mining is a process of extracting unobserved patterns from data. Such patterns and information can represent real value in unlikely circumstances.

Those who work in economics and the law may find themselves confused by, and suspicious of, the latest fads in computer science and analytics. Indeed, concepts in econometrics and statistics are already difficult to convey to judges, juries, and the general public. Expecting a jury composed entirely of mathematics professors is fanciful, so the average economist and lawyer must find a way to convincingly say that X output from Y method is reliable, and presents an accurate account of the facts. In that instance, why make a courtroom analysis even more remote with “data mining” or “machine learning”? Why risk bamboozling a jury, especially with concepts that even the expert witness struggles to understand? The answer is that data mining and machine learning open up new possibilities for economists in the courtroom, if used for the right reasons and articulated in the right manner.

Consider the following case study:

A class action lawsuit is filed against a major Fortune 500 company, alleging gender discrimination. In the complaint, the plaintiffs allege that female executives are, on average, paid less than men. One of the allegations is that starting salaries for women are lower than men, and this bias against women persists as they continue working and advancing at this company. After constructing several different statistical models, the plaintiff’s expert witness economist confirms that the starting salaries for women are, on average, several percentage points lower than men. This pay gap is statistically significant, the findings are robust, and the regressions control for a variety of different employment factors, such as the employee’s department, age, education, and salary grade.

However, the defense now raises an objection in the following vein: “Of course men and women at our firm have different starting salaries. The men we hire tend to have more relevant prior job experience than women.” An employee with more relevant experience would (one would suspect) be paid more than an employee with less relevant prior experience. In that case, the perceived pay gap would not be discriminatory, but a result of an as-of-yet unaccounted variable. So, how can the expert economist quantify relevant prior job experience?

For larger firms, one source could be the employees’ job applications. In this case, each job application was filed electronically and can be read into a data analytics programs. These job applications list the last dozen job titles the employee held, prior to their position at this company. Now the expert economist lets out a small groan. In all, there are tens of thousands of unique job titles. It would be difficult (or if not difficult, silly) to add every single prior job title as a control in the model. So, it would make sense to organize these prior job titles into defined categories. But how?

This is one instance where new techniques in data science come into play.

Upcoming EmployStats Seminar for State Auditors

EmployStats is honored to announce it be teaching a course on statistical sampling for the Texas State Auditors Office (SAO) this winter.  The course, titled Statistical Sampling for Large Audits, will take place online between December 14 and 15, 2020.

The State Auditor’s Office (SAO) is the independent auditor for Texas state government. The SAO performs audits, reviews, and investigations of any entity receiving state funds. EmployStats’ principal economist, Dwight Steward, Ph.D., along with Matt Rigling, MA and Carl McClain, MA, will be instructing this course for auditors from state and local government.

Over this two day, all-online course, the EmployStats team will provide a crash course to participants in the uses of statistical sampling, how statistical samples are conducted, and when statistical samples are legally and scientifically valid in performing audits.

To find out more about the seminar and the Texas State Auditor’s Office, please visit the SAO Website. For more on EmployStats, visit our website: Employstats.com!

Texas Job Market Sees Increased Demand for Medical, Supply Chain Workers Amid Coronavirus

The 2020 coronavirus outbreak has sparked severe shocks to the United States labor market. Social distancing policies, designed to slow the spread of the disease, are leading to large layoffs in specific industries, like bars and restaurants. Many more employees in other sectors face the prospect of unemployment or temporary furloughs. Despite this economic strain, employers, particularly those in Medical and Supply Chain services, are expanding to meet new demand. These sectors continue to post job opportunities long after policymakers mandated the closure of non-essential services or issued “shelter-in-place” orders.

Evidence from Texas over the past half-month reveals both predictable and unexpected trends in new job opportunities. It may come as a surprise that, even in this “lockdown economy,” there is still help wanted.

Beginning on March 18th, Texas began implementing statewide social distancing policies, though some areas began issuing such orders days earlier. Cities and counties across the state gradually adopted “shelter-in-place” orders in March.  By March 31st, a statewide order asked residents to stay home, except if they participated in “essential services and activities.”

But within the past two weeks, Texas employers posted over 66,000 new job openings.

Daily job postings are one indicator of up-to-date labor market demand, available from a variety of sources (most notably online).  The Texas Workforce Commission (“TWC”) is the state agency responsible for managing and providing workforce development services to employers and potential employees in Texas.  One service the TWC provides is access to databases of up-to-date job postings for different occupations and employers within the state. These job postings can come from the TWC itself, or from third party sites like Monster or Indeed. This information is extraordinarily valuable to data scientists.

The top 10 in demand occupations cover a variety of occupations, but are heavily concentrated in the healthcare, supply chain, and IT sectors.

Given the stresses to the healthcare system, its little surprise that hospitals are looking for more front-line staff. Registered Nurses were the highest in demand occupation, with over 3,000 new job listings since March 23rd.


Retail supply chains are also expanding employment.  Sales Representatives for Wholesalers and Manufacturers, with over 2,300 new listings, was the second highest in demand occupation. Other logistical occupations saw large numbers of new openings, particularly for Truck Drivers, with over 1,200 new job postings since March 23rd.

Anecdotally, supermarkets and retail chains have been hiring more employees to meet increased demand for groceries and other supplies. Evidence from jobs posted since March 23rd would support this finding, with large increases in new listings for Customer Service Representatives (over 1,700), Supervisors of Retail Sales Workers (over 1,600), and Retail Salespersons (also over 1,600).

Finally, with the increase in service sector employees working from home, it should not be surprise that IT workers are also in high demand. Application Developers (over 2,100 new listings) and employees for general Computer Occupations (with 1,800 new listings) have both seen large increases in openings since March 23rd.

EmployStats will be closely monitoring daily job postings as the coronavirus outbreak continues.