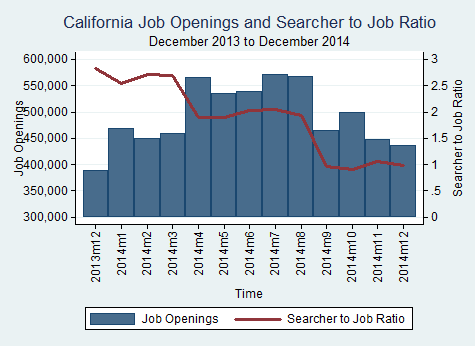
All 4 of the largest MSAs (metropolitan statistical areas) in California experienced a decrease in job openings for the month of November.
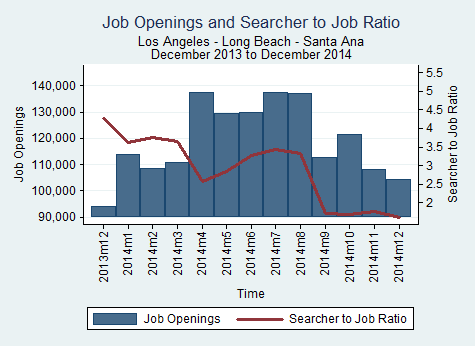
Los Angeles-Long Beach-Santa Ana
The Los Angeles-Long Beach-Santa Ana MSA experienced a decrease of 13,475 job openings in November 2014, a -11.08% change from October 2014.
| Month |
Total Openings |
Percent Monthly Change |
Percent Yearly Change |
| Dec-13 |
94,076 |
-5.48 |
14.93 |
| Jan-14 |
113,912 |
21.09 |
14.93 |
| Feb-14 |
108,563 |
-4.7 |
14.93 |
| Mar-14 |
110,825 |
2.08 |
14.93 |
| Apr-14 |
137,352 |
23.94 |
14.93 |
| May-14 |
129,540 |
-5.69 |
14.93 |
| Jun-14 |
129,782 |
0.19 |
14.93 |
| Jul-14 |
137,333 |
5.82 |
14.93 |
| Aug-14 |
136,939 |
-0.29 |
14.93 |
| Sep-14 |
112,657 |
-17.73 |
14.93 |
| Oct-14 |
121,598 |
7.94 |
14.93 |
| Nov-14 |
108,123 |
-11.08 |
14.93 |
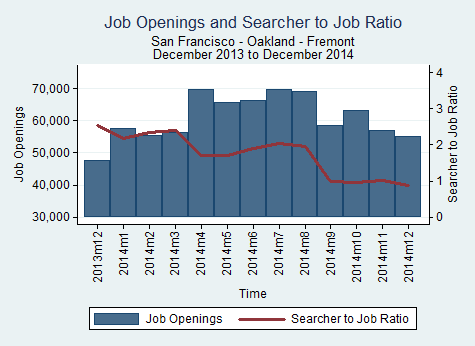
San Francisco-Oakland-Fremont
The San Francisco-Oakland-Fremont MSA experienced a decrease of 6,125 job openings in November 2014, a -9.71% change from October 2014.
| Month |
Total Openings |
Percent Monthly Change |
Percent Yearly Change |
| Dec-13 |
47,699 |
-5.64 |
19.37 |
| Jan-14 |
57,523 |
20.59 |
19.37 |
| Feb-14 |
55,345 |
-3.79 |
19.37 |
| Mar-14 |
56,460 |
2.01 |
19.37 |
| Apr-14 |
69,647 |
23.36 |
19.37 |
| May-14 |
65,783 |
-5.55 |
19.37 |
| Jun-14 |
66,213 |
0.65 |
19.37 |
| Jul-14 |
69,790 |
5.4 |
19.37 |
| Aug-14 |
69,209 |
-0.83 |
19.37 |
| Sep-14 |
58,567 |
-15.38 |
19.37 |
| Oct-14 |
63,065 |
7.68 |
19.37 |
| Nov-14 |
56,940 |
-9.71 |
19.37 |
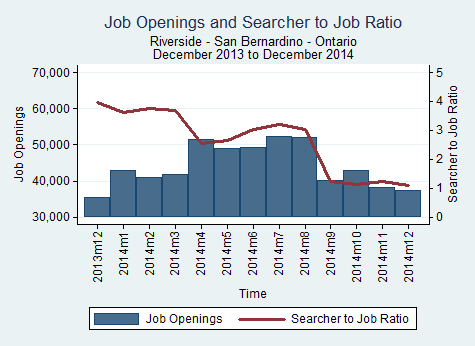
Riverside-San Bernardino-Ontario
The Riverside-San Bernardino-Ontario MSA experienced a decrease of 4,732 job openings in November 2014, a -11.04% change from October 2014.
| Month |
Total Openings |
Percent Monthly Change |
Percent Yearly Change |
| Dec-13 |
35,578 |
-5.81 |
7.2 |
| Jan-14 |
42,940 |
20.69 |
7.2 |
| Feb-14 |
40,977 |
-4.57 |
7.2 |
| Mar-14 |
41,811 |
2.03 |
7.2 |
| Apr-14 |
51,583 |
23.37 |
7.2 |
| May-14 |
48,935 |
-5.13 |
7.2 |
| Jun-14 |
49,141 |
0.42 |
7.2 |
| Jul-14 |
52,360 |
6.55 |
7.2 |
| Aug-14 |
51,924 |
-0.83 |
7.2 |
| Sep-14 |
40,018 |
-22.93 |
7.2 |
| Oct-14 |
42,870 |
7.13 |
7.2 |
| Nov-14 |
38,138 |
-11.04 |
7.2 |
San Diego-Carlsbad-San Marcos
The San Diego-Carlsbad-San Marcos MSA experienced a decrease of 4,452 job openings in November 2014, a -10.02% change from October 2014.
| Month |
Total Openings |
Percent Monthly Change |
Percent Yearly Change |
| Dec-13 |
33,336 |
-5.72 |
19.86 |
| Jan-14 |
40,242 |
20.72 |
19.86 |
| Feb-14 |
38,895 |
-3.35 |
19.86 |
| Mar-14 |
39,795 |
2.31 |
19.86 |
| Apr-14 |
48,989 |
23.1 |
19.86 |
| May-14 |
46,354 |
-5.38 |
19.86 |
| Jun-14 |
46,681 |
0.71 |
19.86 |
| Jul-14 |
49,258 |
5.52 |
19.86 |
| Aug-14 |
49,007 |
-0.51 |
19.86 |
| Sep-14 |
41,343 |
-15.64 |
19.86 |
| Oct-14 |
44,408 |
7.41 |
19.86 |
| Nov-14 |
39,956 |
-10.02 |
19.86 |
Source: BLS