California innovation job openings decreased from April to May

innovation

The number of job openings in California for “Innovation Type Jobs” decreased from 29,183 in April 2015 to 27,484 in May 2015. The searcher-to-job opening ratio increased from 1.34 to 1.40 in the same span.

Innovation jobs definition: http://www.employstats.com/blog/2014/09/26/1233/

innovation_2015_05

Image source: http://www.bizjournals.com/sacramento/news/2013/09/23/symposium-innovation-ecosystems-jobs-wea.html

Source: BLS

California STEM job openings increased from March to April

stem

The number of job openings in California for STEM (science, technology, engineering, math) jobs increased from 72,476 in March 2015 to 85,222 in April 2015. The searcher-to-job opening ratio also increased from 0.97 to 1.89 in the same span.

Our definition of STEM jobs: http://www.employstats.com/blog/2014/09/19/growing-national-interest-in-stem-fields-has-focused-our-research/

STEM_2015_04

Source: BLS

Image source: http://fairmountinc.com/help-wanted-1-2-million-good-paying-jobs-available/

Employment and Wage & Hour Statistics Focus: American Time Use Survey

The American Time Use Survey (ATUS) is commonly used to estimate the amount of time spent on household services for valuing losses in personal injury and wrongful death cases. ATUS is sponsored by the U.S. Bureau of Labor Statistics and administered by the Census Bureau. It measures the amount of time people spend doing various activities, such as working for pay, caring for children, volunteering, commuting, and socializing.

Data collection for the ATUS began in January 2003, and estimates are released annually. The most recent survey was conducted in 2014, and approximately 11,600 individuals were interviewed. The participants were asked to account for every hour between 4 a.m. the day before the interview and 4 a.m. the day of the interview. Using this data, it is possible to construct the average number of hours spent on household services based on demographic characteristics. The categories most often used to measure household services are time spent:

  • Performing inside housework
  • Cooking food and cleaning up after a meal
  • Caring for pets, performing household maintenance, and maintaining vehicles
  • Managing the household
  • Shopping
  • Obtaining services
  • Traveling for household activities
  • Caring for and helping household children
  • Traveling to care for and help household members

The valuation of lost household services is performed by calculating how much it would take, in dollars, for the family to replace the services that were provided by the injured or deceased person. In other words, how much it would cost for the family to go out into the marketplace and pay for each of the individual services, such as having a person mow the lawn or take care of the financial records?

Once the market value of the service, expressed as an hourly rate, is determined, the final replacement cost of each service is calculated by multiplying the hourly market rate by the average number of hours spent performing the services, as reported in the ATUS. For example, in the 2003 ATUS it was reported that the average 24-year-old female spends 2.99 hours per week on food cooking and cleanup. The replacement cost for these services is $9.60 an hour. Therefore, the replacement cost for a week of food cooking and cleanup is $28.70 (2.99 x $9.60) and the annual replacement cost is $1,492.61 (2.99 x $9.60 x 52). The calculation is then performed for all household services for each remaining year of the person’s life expectancy. Finally, the summed loss of household services value must be discounted back to the present day.

Texas innovation job openings increased from Feb to Mar

innovation

The number of job openings in Texas for “Innovation Type Jobs” increased from 13,084 in February 2015 to 13,472 in March 2015. The searcher-to-job opening ratio decreased from 0.50 to 0.41 in the same span.


innovation_2015_03

Innovation jobs definition: http://www.employstats.com/blog/2014/09/26/1233/

Source: BLS

Image source: http://www.americas.gecapital.com/insight-and-ideas/capital-perspectives/innovation-secrets-of-steve-jobs

Texas STEM job openings increased from Feb to Mar

STEM logo

The number of job openings in Texas for STEM (science, technology, engineering, math) jobs increased from 42,970 in February to 43,895 in March 2015. The searcher-to-job opening ratio decreased from 0.71 to 0.61 in the same span.

Our definition of STEM jobs: http://www.employstats.com/blog/2014/09/19/growing-national-interest-in-stem-fields-has-focused-our-research/


STEM_2015_03

Source: BLS

Image source: http://projecttomorrowblog.blogspot.com/2013/11/i-am-scientist.html

Median rent prices fell for two of the three largest Eagle Ford Shale MSAs in April

housing


Median rent fell in San Antonio and Corpus Christi, and increased in Laredo from March 2015 to April 2015.

rent_2015_04

Median house prices for all three MSAs (metropolitan statistical areas) rose from March 2015 to April 2015.

house_2015_04


Image source: http://www.asemooni.com/news/economic-news/the-president-agreed-with-the-increase-in-housing

Crude oil prices see increase while natural gas prices decrease in April 2015

prices_2015_04

Crude oil prices increased from $47.72 per barrel in March 2015 to $59.62 per barrel in April 2015. Natural gas prices went down from $2.65 per million BTU (one million BTU is approximately 974 cubic feet) in March 2015 to $2.56 per million BTU in April 2015.

production_2015_04

Texas crude oil production for April 2015 was 69,595,733 barrels, down from 80,526,870 barrels reported in March 2015. Texas natural gas production was 587,178,094 Mcf (thousand cubic feet) of gas in April 2015, down from the March 2015 natural gas production total of 676,256,565 Mcf.

Source: EIA, Texas RRC

Texas RN’s, therapists, and PA’s see increase in job openings from Mar to Apr

nursing_symbol

The number of job openings in Texas for nurses, therapists, and physician assistants increased from 10,370 to 12,724 from March 2015 to April 2015. The searcher-to-job opening ratio increased from 0.71 to 1.39 during that same span.

nurse_2015_04

Source: BLS

Image source: http://www.carrollhs.org/s/1253/index.aspx?pgid=877

Texas hydro-fracturing job openings increased from Mar to Apr

petroleum engineer
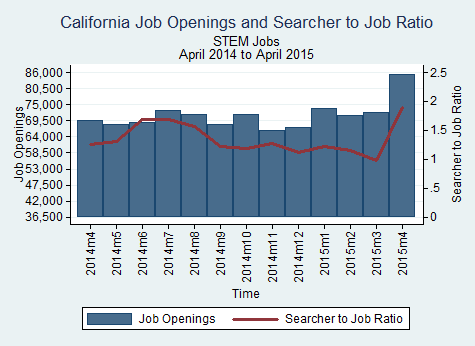
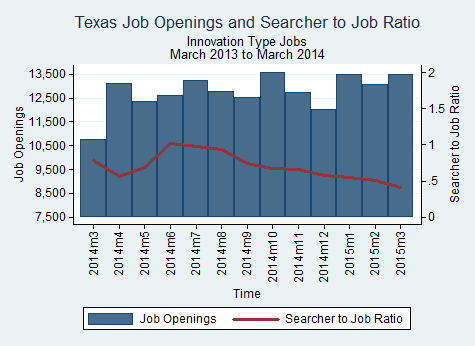
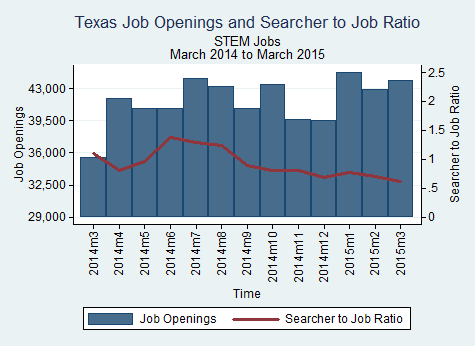
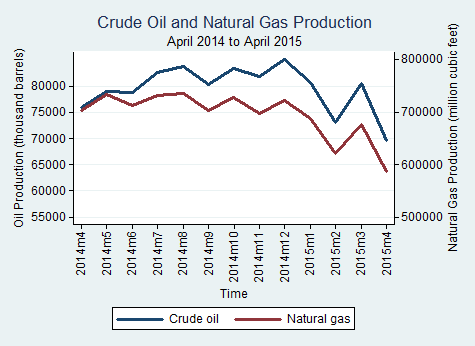
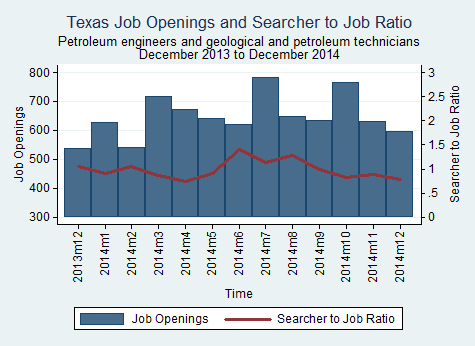
The number of job openings in Texas for “petroleum engineers” and “geological and petroleum technicians” increased from 611 in March 2015 to 661 in April 2015, while the searcher-to-job opening ratio also increased from 0.67 to 1.97 in the same span.petro_engineer_2015_04The number of job openings in Texas for “derrick operators” and “roustabouts” increased from 172 in March 2015 to 181 in April 2015, while the searcher-to-job opening ratio decreased from 6.90 to 2.29 in the same span.

roustabout_2015_04

Source: BLS

Image source: http://wonderfulengineering.com/what-is-petroleum-engineering/