EmployStats Welcomes Proma Paromita

About Proma Paromita

Proma received her Bachelor of Arts in Economics from the Asian University for Women in Bangladesh in the year 2018. After receiving her Bachelor’s degree, Proma traveled to Richardson, TX to attend The University of Texas at Dallas to receive her Master of Science in Econometrics and Quantitative Economics this year. She enjoyed her applied regression and labor economics courses, as well as listening to the University’s podcast.

Proma’s favorites include:

Hobbies:

  • Origami
  • Handcrafts
  • Reading

  • Types of Movies and Books

  • Thriller Movies
  • Detective Novels

  • Favorite Book

  • Big Little Lies by Liane Moriarty

  • Favorite Foods

  • Pasta 
  • Chicken Wings

  • Favorite Quote

  • “I think therefore I am” said by René Descartes
  • We are extremely excited to have Proma on our team. We offer our warmest welcome to our new team member.

    Neumark and Vaccaro write The Career Evolution of the Sex Gap in Wages: Discrimination vs. Human Capital Investment

    The Career Evolution of the Sex Gap in Wages: Discrimination vs. Human Capital Investment was written by David Neumark and Giannina Vaccaro for the National Bureau of Economic Research (NBER).

    Abstract

    Several studies find that there is little sex gap in wages at labor market entry, and that the sex gap in wages emerges (and grows) with time in the labor market. This evidence is consistent with (i) there is little or no sex discrimination in wages at labor market entry, and (ii) the emergence of the sex gap in wages with time in the labor market reflects differences between men and women in human capital investment (and other decisions), with women investing less early in their careers. Indeed, some economists explicitly interpret the evidence this way. We show that this interpretation ignores two fundamental implications of the human capital model, and that differences in investment can complicate the interpretation of both the starting sex gap in wages (or absence of a gap), and the differences in “returns” to experience. We then estimate stylized structural models of human capital investment and wage growth to identify the effects of discrimination and differences in human capital investment, and find evidence more consistent with discrimination reducing women’s wages at labor market entry.

    Read – The Career Evolution of the Sex Gap in Wages: Discrimination vs. Human Capital Investment

    • Find the paper on the NBER website here.
    • Find the paper on the SSRN website here.

    Principles on statistical significance issued by American Statistical Association

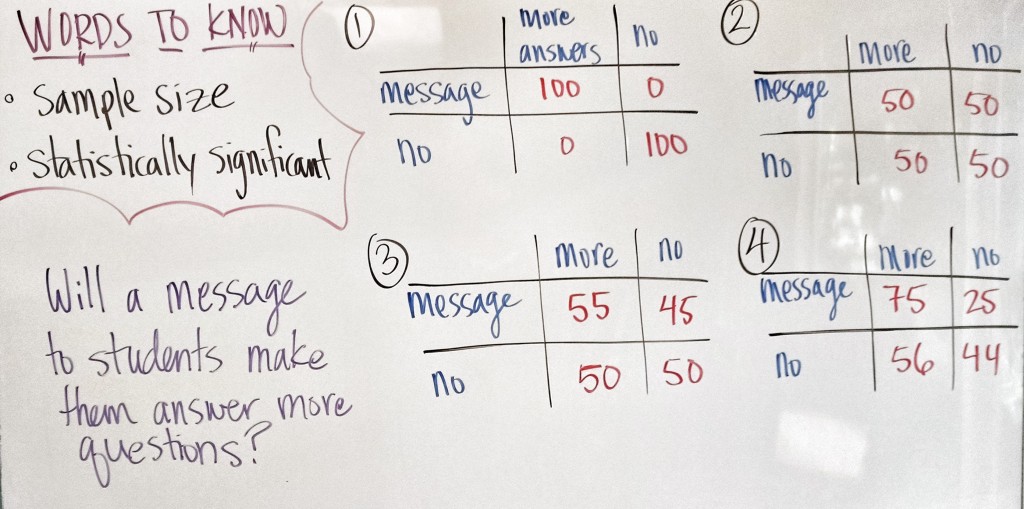
    The American Statistical Association released an important statement and supporting paper concerning the use and interpretation of statistical significance and p-values in statistical research.

    pvalues

    The American Statistical Associations’ statement notes that the increased quantification of scientific research and a proliferation of large, complex data sets, often referred to as Big Data, has expanded the scope for statistics.  Accordingly, the importance of appropriately chosen techniques, properly conducted analyses, and correct interpretation has also increased.

    This statement by the ASA furthers, and in some ways solidifies, the ground roots “counter-statistical significance” movement that many economists and statisticians, such as Steve Zillack and Diedre McCloskey, have been working on for decades.

    Real-World-Matters-Statistically-Significant-1024x509

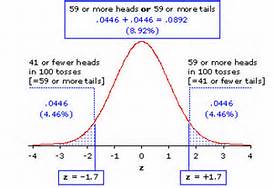
    According to the ASA statement “The p-value [and the concept of statistical significance] was never intended to be a substitute for scientific reasoning,” said Ron Wasserstein, the ASA’s executive director. In research analysts use the data to calculate a p-value which shows how consistent the data is with the research hypothesis.  A small p-value is typically interpreted as having a small likelihood of being consistent with the research hypothesis.   In research papers, small p-values are in essence viewed as a ‘good thing’ and according to the ASA statement, are more favored by journal editors for publication.

    The ASA statement argues against this approach.  Instead, the ASA statement states that “Well-reasoned statistical arguments contain much more than the value of a single number and whether that number exceeds an arbitrary threshold.”

    See:

    Ronald L. Wasserstein & Nicole A. Lazar (2016): The ASA’s statement on p-values: context, process, and purpose, The American Statistician, DOI: 10.1080/00031305.2016.1154108

    Ziliak, S.T., and McCloskey, D.N. (2008), The Cult of Statistical Significance: How the Standard Error Costs Us Jobs, Justice, and Lives, Ann Arbor: University of Michigan Press

    Ziliak, S.T. (2010), “The Validus Medicus and a New Gold Standard,” The Lancet, 376, 9738, 324-325.


    Do employers transmit revenue changes to employee wages? What does BLS big data say about it?

    This paper (ASSA 2016 link below) looks to study revenue and sales volatility at the firm level and how that relates to employee level of wages.  The main take away is that employee wages tend to be positively related to revunue shocks. That is, employers tend to keep employee wages steady and increasing over time regardless of the specific shocks that the firm may be experiencing at any given time. 

    ASSA 2016 paper

    Using Microlevel BLS data to study aggregate wage dispersion

    Can Microlevel BLS data be used to study how and why employees are paid differently at US employers ?  This paper and the work ultimately looks to provide a method to use the Microlevel, i.e. individual level survey observations, to match dispersion measures like, the standard deviation, in big data BLS employment data. The first step for the researchers is to try and match the aggregate numbers to the micro numbers. 

    Texas healthcare jobs increased by 0.7% from Aug to Sept

    healthcareThe health care and social assistance industry gained 9,200 jobs from August 2015 to September 2015. Compared to September 2014, the cumulative number of jobs added in this industry is 67,000, an annual increase of 5.0%.

    Source: http://www.tracer2.com/admin/uploadedPublications/2138_TLMR-Current_Edition.pdf

    Image source: http://blogs.wsj.com/health/2012/01/06/health-care-sector-adds-jobs-as-overall-employment-picture-looks-healthier/

    FLSA OT report for individuals working in truck driving occupations

    In this post, we look at the weekly overtime (OT) hours typically worked by those who work in truck driving occupations.

    Many of the employees that work in these jobs are not exempt from FLSA overtime pay and earn 1.5 times pay for hours worked over 40 in a given week.

    The tabulations below are based on U.S. Bureau of Labor Statistics (BLS) survey data. The BLS job title groups are insightful, generally containing more specific job titles with similar knowledge, skills, and abilities (KSA), but can be more broad than a particular company’s job title listing. Also, some companies may have the job title listed here as exempt from FLSA or state OT due to their specific job assignments. The BLS does not make a distinction as to if the job title is exempt or non-exempt from OT.

    Occupational Group Title Percent of OT Workers Average Hours of OT 1 out of every 4 (25%) OT workers works at least:
    Driver/Sales Workers and Truck Drivers 44.11% 14.5 hours 60 hours

    U.S. BLS data indicates that approximately 44.11% of truck drivers work overtime hours in a given week.  On average, these workers that have FLSA overtime work approximately 14.5 hours a week in OT. The average regular or straight time pay rate of these workers in the U.S. is approximately $18.74 an hour.  The average FLSA OT rate, not including supplemental pay such as non-discretionary bonus pay, is $28.11 an hour.

    Source: BLS (CPS March)

    STEM jobs decreased in CA, but increased in TX for June

    California experienced a decrease of 549 innovation job openings from May 2015 to June 2015, a decrease of 0.69%. Texas experienced an increase of 79 innovation job openings from May 2015 to June 2015, an increase of 0.16%.

    Our definition of STEM jobs: http://www.employstats.com/blog/2014/09/19/growing-national-interest-in-stem-fields-has-focused-our-research/

    STEM logo

    State Total Openings Monthly Change Yearly Change
    CA 79,402 -0.69% 8.76%
    TX 48,441 0.16% 9.83%

    Source: BLS

    Image source: http://projecttomorrowblog.blogspot.com/2013/11/i-am-scientist.html