All 4 of the largest MSAs (metropolitan statistical areas) in California experienced an increase in job openings for the month of April.
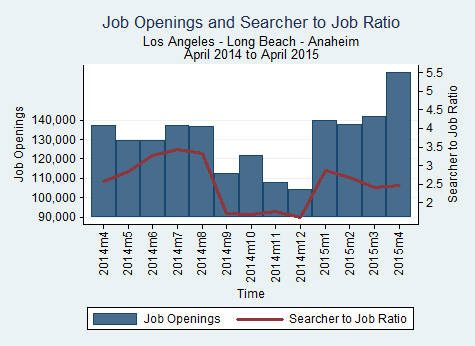
Los Angeles-Long Beach-Anaheim
The Los Angeles-Long Beach-Anaheim MSA experienced an increase of 26,029 job openings in April 2015, an 18.79% change from March 2015.
| Month |
Total Openings |
Percent Monthly Change |
Percent Yearly Change |
| May-14 |
129,540 |
-5.69 |
27.01 |
| Jun-14 |
129,782 |
0.19 |
27.01 |
| Jul-14 |
137,333 |
5.82 |
27.01 |
| Aug-14 |
136,939 |
-0.29 |
27.01 |
| Sep-14 |
112,657 |
-17.73 |
27.01 |
| Oct-14 |
121,598 |
7.94 |
27.01 |
| Nov-14 |
108,123 |
-11.08 |
27.01 |
| Dec-14 |
104,302 |
-3.53 |
27.01 |
| Jan-15 |
140,013 |
34.24 |
27.01 |
| Feb-15 |
137,967 |
-1.46 |
27.01 |
| Mar-15 |
138,496 |
0.38 |
27.01 |
| Apr-15 |
164,525 |
18.79 |
27.01 |
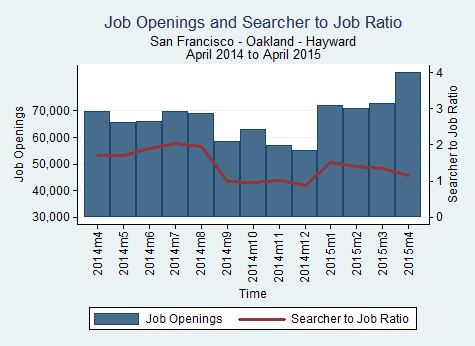
San Francisco-Oakland-Fremont
The San Francisco-Oakland-Fremont MSA experienced an increase of 13,276 job openings in April 2015, an 18.65% change from March 2015.
| Month |
Total Openings |
Percent Monthly Change |
Percent Yearly Change |
| May-14 |
65,783 |
-5.55 |
28.41 |
| Jun-14 |
66,213 |
0.65 |
28.41 |
| Jul-14 |
69,790 |
5.4 |
28.41 |
| Aug-14 |
69,209 |
-0.83 |
28.41 |
| Sep-14 |
58,567 |
-15.38 |
28.41 |
| Oct-14 |
63,065 |
7.68 |
28.41 |
| Nov-14 |
56,940 |
-9.71 |
28.41 |
| Dec-14 |
54,986 |
-3.43 |
28.41 |
| Jan-15 |
72,089 |
31.11 |
28.41 |
| Feb-15 |
70,884 |
-1.67 |
28.41 |
| Mar-15 |
71,196 |
0.44 |
28.41 |
| Apr-15 |
84,472 |
18.65 |
28.41 |
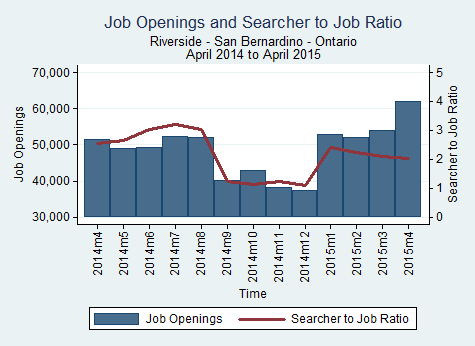
Riverside-San Bernardino-Ontario
The Riverside-San Bernardino-Ontario MSA experienced an increase of 9,550 job openings in April 2015, an 18.21% change from March 2015.
| Month |
Total Openings |
Percent Monthly Change |
Percent Yearly Change |
| May-14 |
48,935 |
-5.13 |
26.71 |
| Jun-14 |
49,141 |
0.42 |
26.71 |
| Jul-14 |
52,360 |
6.55 |
26.71 |
| Aug-14 |
51,924 |
-0.83 |
26.71 |
| Sep-14 |
40,018 |
-22.93 |
26.71 |
| Oct-14 |
42,870 |
7.13 |
26.71 |
| Nov-14 |
38,138 |
-11.04 |
26.71 |
| Dec-14 |
37,377 |
-2 |
26.71 |
| Jan-15 |
52,811 |
41.29 |
26.71 |
| Feb-15 |
52,141 |
-1.27 |
26.71 |
| Mar-15 |
52,454 |
0.6 |
26.71 |
| Apr-15 |
62,004 |
18.21 |
26.71 |
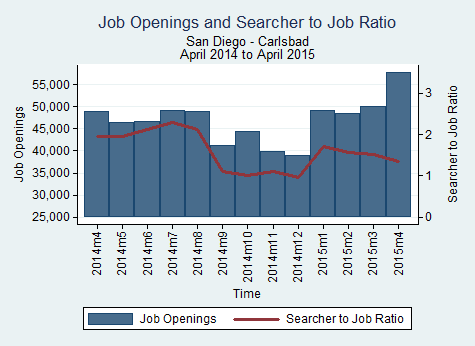
San Diego-Carlsbad-San Marcos
The San Diego-Carlsbad-San Marcos MSA experienced an increase of 8,967 job openings in April 2015, an 18.38% change from March 2015.
| Month |
Total Openings |
Percent Monthly Change |
Percent Yearly Change |
| May-14 |
46,354 |
-5.38 |
24.58 |
| Jun-14 |
46,681 |
0.71 |
24.58 |
| Jul-14 |
49,258 |
5.52 |
24.58 |
| Aug-14 |
49,007 |
-0.51 |
24.58 |
| Sep-14 |
41,343 |
-15.64 |
24.58 |
| Oct-14 |
44,408 |
7.41 |
24.58 |
| Nov-14 |
39,956 |
-10.02 |
24.58 |
| Dec-14 |
38,937 |
-2.55 |
24.58 |
| Jan-15 |
49,272 |
26.54 |
24.58 |
| Feb-15 |
48,492 |
-1.58 |
24.58 |
| Mar-15 |
48,782 |
0.6 |
24.58 |
| Apr-15 |
57,749 |
18.38 |
24.58 |
Source: BLS