
Median house prices for all three MSAs (metropolitan statistical areas) fell from December 2014 to January 2014.
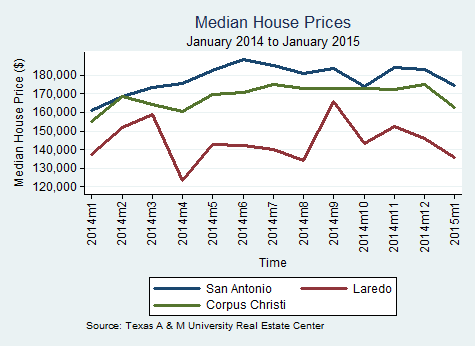
Image source: http://www.asemooni.com/news/economic-news/the-president-agreed-with-the-increase-in-housing
Median house prices for all three MSAs (metropolitan statistical areas) fell from December 2014 to January 2014.
Image source: http://www.asemooni.com/news/economic-news/the-president-agreed-with-the-increase-in-housing

WTI crude oil price increased from $47.79 per barrel in January 2015 to $53.56 per barrel mid February 2015. Natural gas price fell from $2.88 per million BTU (one million BTU is approximately 974 cubic feet) in January 2015 to $2.75 per million BTU mid February 2015.

Texas crude oil production for December 2014 was 67,660,682 barrels, down from 74,910,932 barrels reported in November 2014. Texas natural gas production was 600,389,620 Mcf (thousand cubic feet) of gas in December 2014, down from the November 2014 gas production total of 675,593,444 Mcf.
Sources: eia.gov, rrc.state.tx.us

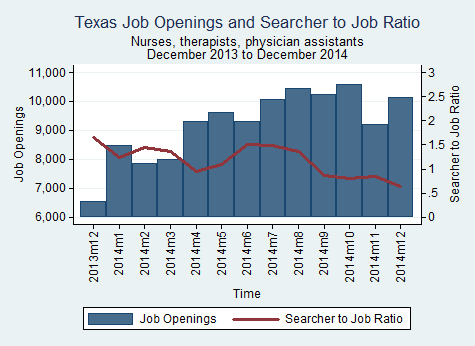
The number of job openings in Texas for nurses, therapists, and physician assistants increased from 9,189 to 10,144 from November 2014 to December 2014. The searcher-to-job opening ratio decreased from 0.85 to 0.63 during that same span.
Source: BLS
Image source: http://www.carrollhs.org/s/1253/index.aspx?pgid=877

The oil and gas extraction industry in Texas gained 600 jobs from November 2014 to December 2014. Compared to December 2013, the cumulative number of jobs added in this industry is 5,600, an increase of 5.2%.
Source: http://www.tracer2.com/admin/uploadedPublications/2127_TLMR-January_15.pdf
Image Source: http://www.eliteexploration.com/texas-oil-gas-companies/
Texas December 2014
Total number of job openings and median searcher-to-job ratio across all MSAs (metropolitan statistical areas) for each major occupational group in Texas in December 2014.
| Occupation | Job Openings | Searcher-to-Job Ratio |
| Management, business, and financial occupations | 81,943 | 0.4 |
| Service occupations | 93,411 | 0.78 |
| Office and administrative support occupations | 72,852 | 0.95 |
| Professional and related occupations | 134,368 | 1.13 |
| Farming, fishing, and forestry occupations | 1,508 | 1.38 |
| Sales and related occupations | 37,555 | 2.62 |
| Construction and extraction occupations | 14,382 | 50.69 |
Source: BLS
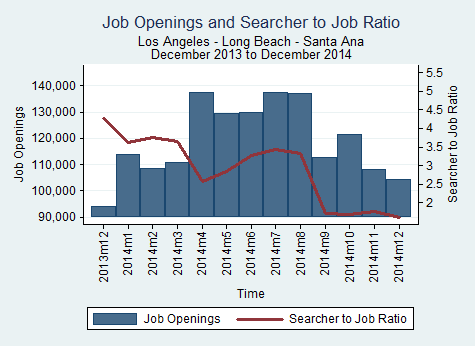

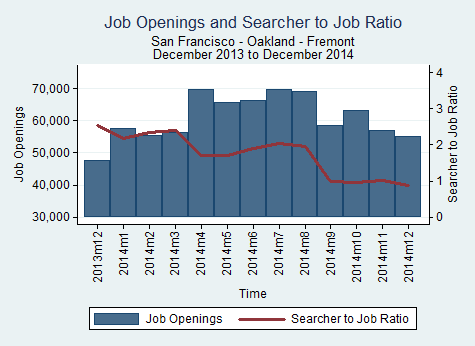
Compared to December of last year, all of the main MSAs (metropolitan statistical areas) in California saw an annual increase in the number of job openings and decrease in the searcher-to-job opening ratio.
Source: BLS
In this post, we look at the weekly overtime (OT) hours typically worked by those who work in Truck Transportation.
Many of the employees that work in these jobs are not exempt from FLSA overtime pay and earn 1.5 times pay for hours worked over 40 in a given week.
The tabulations below are based on U.S. BLS survey data. The BLS job title groups are insightful, generally containing more specific job titles with similar knowledge, skills, and abilities (KSA), but can be more broad than a particular company’s job title listing. Also, some companies may have the job title listed here as exempt from FLSA or state OT due to their specific job assignments. The BLS does not make a distinction as to if the job title is exempt or non-exempt from OT.
| Occupational Group Title | Percent of OT Workers | Average Hours of OT | 1 out of every 4 (25%) OT workers works at least: |
| Truck Transportation | 47.28% | 15 hours | 60 hours |
Source: BLS (CPS March)
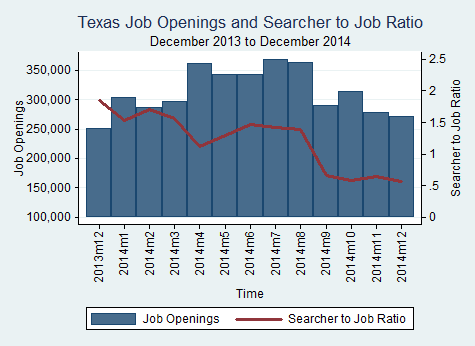
The number of job openings in Texas decreased from 278,989 in November 2014 to 270,849 in December 2014. The median number of job searchers per job opening across all MSAs (metropolitan statistical areas) and occupations in Texas was 0.64 in November 2014 and 0.56 in December 2014.
Source: BLS
California experienced a decrease of 1,271 innovation job openings from October 2014 to November 2014, a decrease of 4.95%. Texas experienced a decrease of 820 innovation job openings from October 2014 to November 2014, a decrease of 39.48%.

| State | Total Openings | Monthly Change | Yearly Change |
| CA | 24,404 | -4.95% | 40.40% |
| TX | 12,748 | -6.05% | 39.48% |
Innovation jobs definition: http://www.employstats.com/blog/2014/09/26/1233/
Source: BLS
Image source: http://www.bizjournals.com/sacramento/news/2013/09/23/symposium-innovation-ecosystems-jobs-wea.html
All 4 of the largest MSAs (metropolitan statistical areas) in California experienced a decrease in job openings for the month of November.
Los Angeles-Long Beach-Santa Ana
The Los Angeles-Long Beach-Santa Ana MSA experienced a decrease of 13,475 job openings in November 2014, a -11.08% change from October 2014.
| Month | Total Openings | Percent Monthly Change | Percent Yearly Change |
| Dec-13 | 94,076 | -5.48 | 14.93 |
| Jan-14 | 113,912 | 21.09 | 14.93 |
| Feb-14 | 108,563 | -4.7 | 14.93 |
| Mar-14 | 110,825 | 2.08 | 14.93 |
| Apr-14 | 137,352 | 23.94 | 14.93 |
| May-14 | 129,540 | -5.69 | 14.93 |
| Jun-14 | 129,782 | 0.19 | 14.93 |
| Jul-14 | 137,333 | 5.82 | 14.93 |
| Aug-14 | 136,939 | -0.29 | 14.93 |
| Sep-14 | 112,657 | -17.73 | 14.93 |
| Oct-14 | 121,598 | 7.94 | 14.93 |
| Nov-14 | 108,123 | -11.08 | 14.93 |
San Francisco-Oakland-Fremont
The San Francisco-Oakland-Fremont MSA experienced a decrease of 6,125 job openings in November 2014, a -9.71% change from October 2014.
| Month | Total Openings | Percent Monthly Change | Percent Yearly Change |
| Dec-13 | 47,699 | -5.64 | 19.37 |
| Jan-14 | 57,523 | 20.59 | 19.37 |
| Feb-14 | 55,345 | -3.79 | 19.37 |
| Mar-14 | 56,460 | 2.01 | 19.37 |
| Apr-14 | 69,647 | 23.36 | 19.37 |
| May-14 | 65,783 | -5.55 | 19.37 |
| Jun-14 | 66,213 | 0.65 | 19.37 |
| Jul-14 | 69,790 | 5.4 | 19.37 |
| Aug-14 | 69,209 | -0.83 | 19.37 |
| Sep-14 | 58,567 | -15.38 | 19.37 |
| Oct-14 | 63,065 | 7.68 | 19.37 |
| Nov-14 | 56,940 | -9.71 | 19.37 |
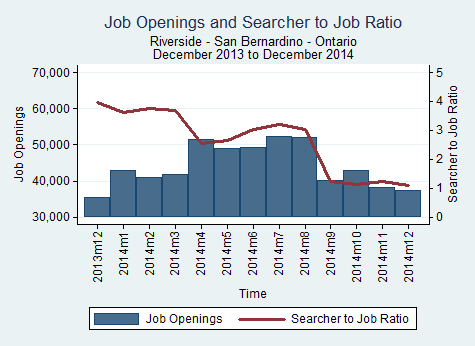
Riverside-San Bernardino-Ontario
The Riverside-San Bernardino-Ontario MSA experienced a decrease of 4,732 job openings in November 2014, a -11.04% change from October 2014.
| Month | Total Openings | Percent Monthly Change | Percent Yearly Change |
| Dec-13 | 35,578 | -5.81 | 7.2 |
| Jan-14 | 42,940 | 20.69 | 7.2 |
| Feb-14 | 40,977 | -4.57 | 7.2 |
| Mar-14 | 41,811 | 2.03 | 7.2 |
| Apr-14 | 51,583 | 23.37 | 7.2 |
| May-14 | 48,935 | -5.13 | 7.2 |
| Jun-14 | 49,141 | 0.42 | 7.2 |
| Jul-14 | 52,360 | 6.55 | 7.2 |
| Aug-14 | 51,924 | -0.83 | 7.2 |
| Sep-14 | 40,018 | -22.93 | 7.2 |
| Oct-14 | 42,870 | 7.13 | 7.2 |
| Nov-14 | 38,138 | -11.04 | 7.2 |
San Diego-Carlsbad-San Marcos
The San Diego-Carlsbad-San Marcos MSA experienced a decrease of 4,452 job openings in November 2014, a -10.02% change from October 2014.
| Month | Total Openings | Percent Monthly Change | Percent Yearly Change |
| Dec-13 | 33,336 | -5.72 | 19.86 |
| Jan-14 | 40,242 | 20.72 | 19.86 |
| Feb-14 | 38,895 | -3.35 | 19.86 |
| Mar-14 | 39,795 | 2.31 | 19.86 |
| Apr-14 | 48,989 | 23.1 | 19.86 |
| May-14 | 46,354 | -5.38 | 19.86 |
| Jun-14 | 46,681 | 0.71 | 19.86 |
| Jul-14 | 49,258 | 5.52 | 19.86 |
| Aug-14 | 49,007 | -0.51 | 19.86 |
| Sep-14 | 41,343 | -15.64 | 19.86 |
| Oct-14 | 44,408 | 7.41 | 19.86 |
| Nov-14 | 39,956 | -10.02 | 19.86 |
Source: BLS