STEM jobs increased in both CA and TX for the month of July

California experienced an increase of 4,253 innovation job openings from June 2014 to July 2014, an increase of 7.19%. Texas experienced an increase of 3,239 innovation job openings from June 2014 to July 2014, an increase of 7.92%.

Our definition of STEM jobs: http://www.employstats.com/blog/2014/09/19/growing-national-interest-in-stem-fields-has-focused-our-research/

STEM logo


State Total_Openings Monthly_Change Yearly_Change
CA 73,005 6.19% 26.22%
TX 44,105 7.92% 27.89%

Source: BLS

Image source: http://projecttomorrowblog.blogspot.com/2013/11/i-am-scientist.html

Texas hydro-fracturing job openings increased from June 2014 to July 2014

petroleum engineer
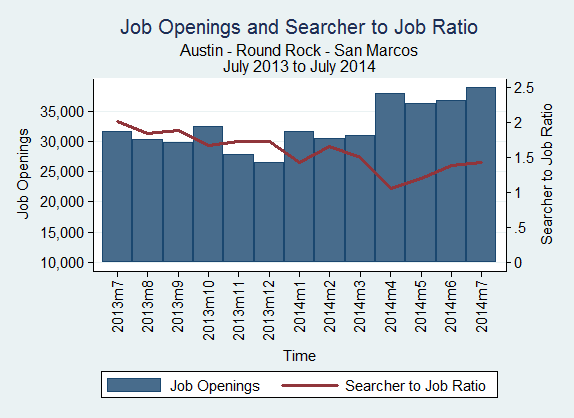
The number of job openings in Texas for “petroleum engineers” and “geological and petroleum technicians” increased from 622 in June 2014 to 782 in July 2014, while the searcher-to-job opening ratio decreased from 1.4 to 1.1 in the same span.


petro_engineer_2014_07

The number of job openings in Texas for “derrick operators” and “roustabouts” increased from 270 in June 2014 to 368 in July 2014, while the searcher-to-job opening ratio decreased from 3.0 to 1.7 in the same span.roustabout_2014_07

Source: BLS

Image source: http://wonderfulengineering.com/what-is-petroleum-engineering/

Innovation sector jobs increased in both CA and TX for the month of July

California experienced an increase of 733 innovation job openings from June 2014 to July 2014, an increase of 3.01%. Texas experienced an increase of 606 innovation job openings from June 2014 to July 2014, an increase of 4.80%.

innovation

State Total_Openings Monthly_Change Yearly_Change
CA 25,143 3.01% 30.27%
TX 13,218 4.80% 31.45%

California experienced an increase of 733 innovation job openings from June 2014 to July 2014, an increase of 3.01%. Texas experienced an increase of 606 innovation job openings from June 2014 to July 2014, an increase of 4.80%.

Innovation jobs definition: http://www.employstats.com/blog/2014/09/26/1233/

Source: BLS

Image source: http://www.bizjournals.com/sacramento/news/2013/09/23/symposium-innovation-ecosystems-jobs-wea.html

What is an innovation job?

innovation

Below is our list of innovation jobs we have compiled for use in our research:

-Computer and information research scientists

-Computer systems analysts

-Information security analysts

-Computer programmers

-Software developers, applications and systems software

-Web developers

-Computer support specialists

-Data base administrators

-Computer network architects

-Computer occupations, all other

-Architects, except naval

-Electrical and electronic engineers

-Artists and related workers

-Designers

-Actors

-Producers and directors

Source: BLS

Image source: http://www.americas.gecapital.com/insight-and-ideas/capital-perspectives/innovation-secrets-of-steve-jobs

Texas oil and gas extraction jobs decreased by 0.6% from July 2014 to August 2014

texas-oil-and-gas-image


The oil and gas extraction industry in Texas lost 700 jobs from July 2014 to August 2014. Compared to August 2013, the cumulative number of jobs added in this industry is 8,500, an increase of 8.0%.

Source: http://www.tracer2.com/admin/uploadedPublications/2119_TLMR-September_14.pdf

Image Source: http://www.eliteexploration.com/texas-oil-gas-companies/

Texas job openings by major occupational group

Texas July 2014

Total number of job openings and median searcher-to-job ratio across all MSAs (metropolitan statistical areas) for each major occupational group in Texas in July 2014.

Occupation Openings S2J_Ratio
Management, business, and financial occupations 57111 0.65
Professional and related occupations 82733 1.14
Office and administrative support occupations 55874 1.18
Installation, maintenance, and repair occupations 18904 1.46
Sales and related occupations 29695 1.59
Service occupations 63649 1.67
Transportation and material moving occupations 20408 1.97
Farming, fishing, and forestry occupations 968 2.62
Production occupations 22287 2.83
Construction and extraction occupations 17156 3.91

Source: BLS

4 largest Texas MSAs see increase in job openings from June 2014 to July 2014

All 4 of the largest MSAs (metropolitan statistical areas) in Texas experienced an increase in job openings for the month of July.

Dallas

Dallas experienced an increase of 5,815 job openings from June 2014 to July 2014, a 6.86% increase.

Date Total_Openings Monthly_Change Yearly_Change
Jul-14 90586 6.86% 28.67%
Jun-14 84771 0.29% 15.23%
May-14 84526 -5.64% 20.19%
Apr-14 89581 23.25% 26.62%
Mar-14 72682 2.48% -2.52%
Feb-14 70922 -5.29% 1.27%
Jan-14 74887 20.21% 12.54%
Dec-13 62296 -4.16% -8.80%
Nov-13 65003 -14.98% 17.30%
Oct-13 76452 8.40% 26.29%
Sep-13 70526 0.18% 0.12%
Aug-13 70400 -4.30% 7.91%

Austin

Austin experienced an increase of 2,190 job openings from June 2014 to July 2014, a 5.96% increase.

Date Total_Openings Monthly_Change Yearly_Change
Jul-14 38938 5.96% 28.50%
Jun-14 36748 1.44% 15.98%
May-14 36228 -4.59% 19.27%
Apr-14 37971 22.48% 25.01%
Mar-14 31001 1.83% -3.11%
Feb-14 30443 -3.77% 0.38%
Jan-14 31635 19.32% 9.52%
Dec-13 26512 -4.77% -10.09%
Nov-13 27840 -14.33% 15.78%
Oct-13 32499 9.20% 25.10%
Sep-13 29760 -1.79% -1.33%
Aug-13 30302 -4.36% 8.57%

Houston

Houston experienced an increase of 6,265 job openings from June 2014 to July 2014, a 8.29% increase.

Date Total_Openings Monthly_Change Yearly_Change
Jul-14 81792 8.29% 29.66%
Jun-14 75527 -0.09% 14.68%
May-14 75596 -5.17% 20.16%
Apr-14 79716 20.94% 26.09%
Mar-14 65912 3.59% -1.16%
Feb-14 63626 -5.45% 2.27%
Jan-14 67291 20.11% 12.98%
Dec-13 56026 -3.63% -8.46%
Nov-13 58138 -14.60% 16.91%
Oct-13 68074 8.40% 25.92%
Sep-13 62801 -0.44% 0.47%
Aug-13 63080 -4.22% 8.56%

San Antonio

San Antonio experienced an increase of 2,047 job openings from June 2014 to July 2014, a 6.00% increase.

Date Total_Openings Monthly_Change Yearly_Change
Jul-14 36164 6.00% 27.85%
Jun-14 34117 0.26% 15.48%
May-14 34029 -5.52% 20.28%
Apr-14 36017 23.93% 26.62%
Mar-14 29061 2.62% -2.85%
Feb-14 28320 -5.47% 0.33%
Jan-14 29958 21.97% 12.89%
Dec-13 24561 -5.12% -8.66%
Nov-13 25887 -14.61% 17.03%
Oct-13 30316 6.88% 25.77%
Sep-13 28365 0.28% 1.02%
Aug-13 28286 -4.26% 9.12%

Source: BLS

Couch surfing: what do U.S. BLS surveys have to say about it?

According to dictionary.com:

[kouch-surf] couch surfing: sleeping on the couch or extra bed of an acquaintance when traveling or between permanent lodging places, esp. to save money.


Couch surfing, is an alternative way of living and traveling, especially among the young,  There are even websites, like https://www.couchsurfing.org/, dedicated to making couch surfing matches.


The prevalence of couch surfing can be measured to a good degree by U.S BLS Consumer Expenditure Survey data.  The table below shows the break down of who owns outright (1), owns with a mortgage (2), rents (3), stays without rent  (4), and who stays in a dorm (5).

couchsurf


The move by private employers to make salary information public

Some employers, both private and public, are moving towards making employee’s salaries public.  “Making Pay Public” by Tamara Lytle , in HR Magazine, September 2014. discusses the recent trend of employers making employee’s salaries more open.

Some employers such as, Buffer, are going so far as to not only making their salaries public, but are also providing details on the decision process by which the employee’s  salary was determined. For example, Buffer’s salary formula has set factors that take into account the employee’s job type, seniority, experience, location, and equity versus salary choice.

In the formula, engineers and designers have a base salary of $60.000 while content crafters have a base salary of $50,000.  Employees in Austin receive a $12,000 salary kicker, while employees in San Franciso receive a $22,000 salary kicker.   Buffer’s (and other’s) approach to salary is clearly a different approach from how some employers had pay discussions in the past.

A 1943 HR Manual from Disney: