California and Texas both saw greater decrease in job openings than US for August

California and Texas both experienced a greater decrease in job openings than the US for the month of August.

August 2014

Location Total_Openings Monthly_Change Yearly_Change
CA 566,834 -0.67% 27.78%
TX 364,236 -1.23% 27.59%
US 4,543,314 -0.56% 27.82%

Source: BLS

Innovation sector jobs decreased in both CA and TX for the month of August

California experienced a decrease of 1,011 innovation job openings from July 2014 to August 2014, a decrease of 4.02%. Texas experienced a decrease of 456 innovation job openings from July 2014 to August 2014, a decrease of 3.45%.

innovation

State Total_Openings Monthly_Change Yearly_Change
CA 24,132 -4.02% 29.71%
TX 12,762 -3.45% 30.67%

Innovation jobs definition: http://www.employstats.com/blog/2014/09/26/1233/

Source: BLS

Image source: http://www.bizjournals.com/sacramento/news/2013/09/23/symposium-innovation-ecosystems-jobs-wea.html

STEM jobs decreased in both CA and TX for the month of August

California experienced a dencrease of 1,184 innovation job openings from July 2014 to August 2014, a decrease of 1.62%. Texas experienced a decrease of 895 innovation job openings from July 2014 to August 2014, a decrease of 2.03%.

Our definition of STEM jobs: http://www.employstats.com/blog/2014/09/19/growing-national-interest-in-stem-fields-has-focused-our-research/

STEM logo

State Total_Openings Monthly_Change Yearly_Change
CA 71,821 -1.62% 32.78%
TX 43,210 -2.03% 32.61%

Source: BLS

Image source: http://projecttomorrowblog.blogspot.com/2013/11/i-am-scientist.html

4 largest California MSAs see decrease in job openings for August

All 4 of the largest MSAs (metropolitan statistical areas) in California experienced a decrease in job openings for the month of August.

Los Angeles-Long Beach-Santa Ana

The Los Angeles-Long Beach-Santa Ana MSA experienced a decrease of 394 job openings in August 2014, a -0.29% change from July 2014.

Month Total_Openings Percent_Monthly_Change Percent_Yearly_Change
Sep-13 107,881 0.16 26.93
Oct-13 116,232 7.74 26.93
Nov-13 99,534 -14.37 26.93
Dec-13 94,076 -5.48 26.93
Jan-14 113,912 21.09 26.93
Feb-14 108,563 -4.7 26.93
Mar-14 110,825 2.08 26.93
Apr-14 137,352 23.94 26.93
May-14 129,540 -5.69 26.93
Jun-14 129,782 0.19 26.93
Jul-14 137,333 5.82 26.93
Aug-14 136,939 -0.29 26.93

San Francisco-Oakland-Fremont

The San Francisco-Oakland-Fremont MSA experienced a decrease of 581 job openings in August 2014, a -0.83% change from July 2014.

Month Total_Openings Percent_Monthly_Change Percent_Yearly_Change
Sep-13 54,100 -0.73 27.93
Oct-13 58,926 8.92 27.93
Nov-13 50,552 -14.21 27.93
Dec-13 47,699 -5.64 27.93
Jan-14 57,523 20.59 27.93
Feb-14 55,345 -3.79 27.93
Mar-14 56,460 2.01 27.93
Apr-14 69,647 23.36 27.93
May-14 65,783 -5.55 27.93
Jun-14 66,213 0.65 27.93
Jul-14 69,790 5.4 27.93
Aug-14 69,209 -0.83 27.93

Riverside-San Bernardino-Ontario

The Riverside-San Bernardino-Ontario MSA experienced a decrease of 436 job openings in August 2014, a 0.83% change from July 2014.

Month Total_Openings Percent_Monthly_Change Percent_Yearly_Change
Sep-13 41,049 -0.3 26.49
Oct-13 43,869 6.87 26.49
Nov-13 37,771 -13.9 26.49
Dec-13 35,578 -5.81 26.49
Jan-14 42,940 20.69 26.49
Feb-14 40,977 -4.57 26.49
Mar-14 41,811 2.03 26.49
Apr-14 51,583 23.37 26.49
May-14 48,935 -5.13 26.49
Jun-14 49,141 0.42 26.49
Jul-14 52,360 6.55 26.49
Aug-14 51,924 -0.83 26.49

 San Diego-Carlsbad-San Marcos

The San Diego-Carlsbad-San Marcos MSA experienced a decrease of 251 job openings in August 2014, a 0.51% change from July 2014.

Month Total_Openings Percent_Monthly_Change Percent_Yearly_Change
Sep-13 38,068 -1.18 28.74
Oct-13 41,147 8.09 28.74
Nov-13 35,358 -14.07 28.74
Dec-13 33,336 -5.72 28.74
Jan-14 40,242 20.72 28.74
Feb-14 38,895 -3.35 28.74
Mar-14 39,795 2.31 28.74
Apr-14 48,989 23.1 28.74
May-14 46,354 -5.38 28.74
Jun-14 46,681 0.71 28.74
Jul-14 49,258 5.52 28.74
Aug-14 49,007 -0.51 28.74

Source: BLS

Top 3 occupations with the most new job openings in California for August

The top three occupations with the most new job openings in California for the month of August were grounds maintenance workers with 3,366 new openings, cashiers with 3,643 new openings, and managers, all other with 3,687 new openings.

August 2014

Month Occupation Total_Openings New_Openings
Aug-14 Grounds maintenance workers 6,868 3,366
Aug-14 Cashiers 9,288 3,643
Aug-14 Managers, all other 9,939 3,687

Source: BLS

California RN’s, PA’s, and therapists see increase in job openings from July 2014 to August 2014

healthcare

The number of job openings in California for nurses, therapists, and physician assistants increased from 16,429 in July 2014 to 16,994 in August 2014. The searcher-to-job opening ratio decreased from 2.10 to 1.90 in the same span.

nurse_2014_08

Source: BLS

Image source: http://pediatric-nurse-practitioners.blogspot.com/2012/12/top-5-cardiac-care-nursing-jobs-for-we.html

California innovation job openings decreased from July 2014 to August 2014

innovation

The number of job openings in California for “Innovation Type Jobs” decreased from 25,143 in July 2014 to 24,132 in August 2014. The searcher-to-job opening ratio also decreased from 1.09 to 1.06 in the same span.

Innovation jobs definition: http://www.employstats.com/blog/2014/09/26/1233/

innovation_2014_08

Image source: http://www.bizjournals.com/sacramento/news/2013/09/23/symposium-innovation-ecosystems-jobs-wea.html

California STEM job openings decreased from July 2014 to August 2014

stem

The number of job openings in California for STEM (science, technology, engineering, math) jobs decreased from 73,005 in July 2014 to 71,821 in August 2014. The searcher-to-job opening ratio also decreased from 1.69 to 1.57 in the same span.

Our definition of STEM jobs: http://www.employstats.com/blog/2014/09/19/growing-national-interest-in-stem-fields-has-focused-our-research/

STEM_2014_08

Source: BLS

Image source: http://fairmountinc.com/help-wanted-1-2-million-good-paying-jobs-available/

U.S. Commerce Department data show Internet retail sales continue to grow

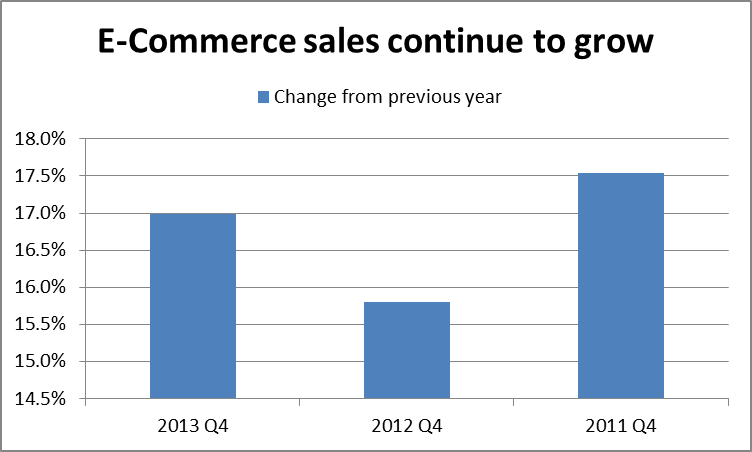
Retail sales over the internet continue to increase in the U.S.

Internet sales, or as the Commerce department puts it:  sales of goods and services where an order is placed by the buyer or price and terms of sale are negotiated over an Internet, extranet, Electronic Data Interchange (EDI) network electronic mail, or other online system, have increased over 15% each year of the last three years.

E-Commerce now makes up about 6% of all retail sales in the U.S.

Internetsales

Source: http://www2.census.gov/retail/releases/historical/ecomm/

Time Period E-commerce Sales Change from previous year
2013 Q4                83,709 17.0%
2012 Q4                71,554 15.8%
2011 Q4                61,789 17.5%
2010 Q4                52,567


.