All four largest MSAs (metropolitan statistical areas) in Texas experienced a decrease in job openings from May 2015 to June 2015.
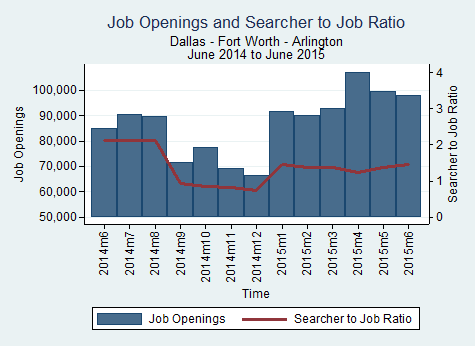
Dallas
Dallas experienced a decrease of 1,630 job openings from May 2015 to June 2015, a 1.64% decrease.
| Date |
Total Openings |
Monthly Change |
Yearly Change |
| June 2015 |
98,055 |
-1.64% |
8.25% |
| May 2015 |
99,685 |
-7.56% |
17.59% |
| April 2015 |
107,841 |
16.39% |
27.58% |
| March 2015 |
92,653 |
2.87% |
3.43% |
| February 2015 |
90,072 |
-1.85% |
23.93% |
| January 2015 |
91,770 |
38.18% |
29.39% |
| December 2014 |
66,413 |
-4.20% |
-11.31% |
| November 2014 |
69,326 |
-10.74% |
11.28% |
| October 2014 |
77,670 |
8.74% |
19.49% |
| September 2014 |
71,430 |
-20.43% |
-6.57% |
| August 2014 |
89,770 |
-0.90% |
27.29% |
| July 2014 |
90,586 |
6.86% |
28.67% |
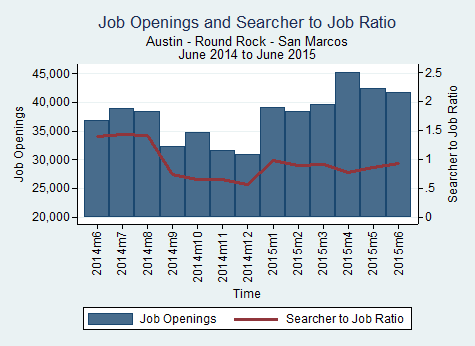
Austin
Austin experienced a decrease of 598 job openings from May 2015 to June 2015, a 1.41% decrease.
| Date |
Total Openings |
Monthly Change |
Yearly Change |
| June 2015 |
41,742 |
-1.41% |
7.20% |
| May 2015 |
42,340 |
-6.97% |
15.22% |
| April 2015 |
45,514 |
15.12% |
25.63% |
| March 2015 |
39,536 |
3.03% |
4.12% |
| February 2015 |
38,372 |
-1.78% |
23.78% |
| January 2015 |
39,066 |
26.19% |
28.32% |
| December 2014 |
30,957 |
-1.84% |
-2.14% |
| November 2014 |
31,539 |
-9.03% |
18.96% |
| October 2014 |
34,670 |
7.17% |
24.53% |
| September 2014 |
32,352 |
-15.59% |
-0.45% |
| August 2014 |
38,327 |
-1.57% |
28.78% |
| July 2014 |
38,938 |
5.96% |
28.50% |
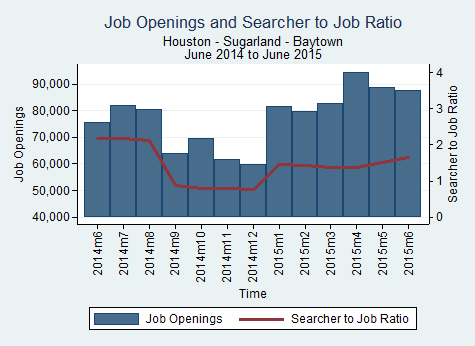
Houston
Houston experienced a decrease of 932 job openings from May 2015 to June 2015, a 1.05% decrease.
| Date |
Total Openings |
Monthly Change |
Yearly Change |
| June 2015 |
87,680 |
-1.05% |
7.20% |
| May 2015 |
88,612 |
-7.15% |
17.32% |
| April 2015 |
95,434 |
15.36% |
26.24% |
| March 2015 |
82,726 |
3.76% |
3.78% |
| February 2015 |
79,730 |
-2.12% |
20.96% |
| January 2015 |
81,454 |
35.88% |
28.02% |
| December 2014 |
59,945 |
-3.04% |
-10.92% |
| November 2014 |
61,824 |
-11.15% |
10.35% |
| October 2014 |
69,582 |
8.73% |
19.68% |
| September 2014 |
63,998 |
-20.30% |
-5.99% |
| August 2014 |
80,299 |
-1.83% |
27.86% |
| July 2014 |
81,792 |
8.29% |
29.66% |
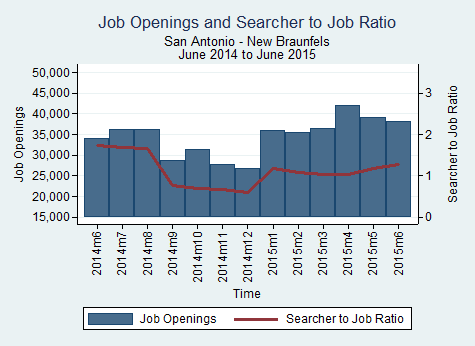
San Antonio
San Antonio experienced a decrease of 920 job openings from May 2015 to June 2015, a 2.36% decrease.
| Date |
Total Openings |
Monthly Change |
Yearly Change |
| June 2015 |
38,089 |
-2.36% |
5.32% |
| May 2015 |
39,009 |
-8.05% |
14.34% |
| April 2015 |
42,425 |
16.19% |
24.67% |
| March 2015 |
36,512 |
2.73% |
1.38% |
| February 2015 |
35,543 |
-1.08% |
22.30% |
| January 2015 |
35,932 |
34.70% |
26.88% |
| December 2014 |
26,676 |
-3.61% |
-10.95% |
| November 2014 |
27,676 |
-11.80% |
12.69% |
| October 2014 |
31,377 |
8.93% |
21.21% |
| September 2014 |
28,805 |
-20.44% |
-4.98% |
| August 2014 |
36,207 |
0.12% |
27.65% |
| July 2014 |
36,164 |
6.00% |
27.85% |
Source: BLS
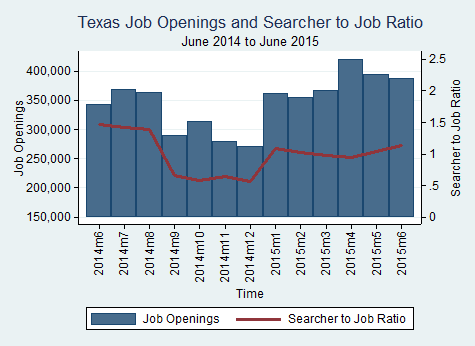


 The number of job openings in Texas for “petroleum engineers” and “geological and petroleum technicians” decreased from 661 in April 2015 to 639 in May 2015, while the searcher-to-job opening ratio increased from 1.97 to 2.16 in the same span.