NY-NJ-PA MSA experienced the largest increase in job openings of all US MSAs for August

The New York-Northern New Jersey-Long Island MSA (metropolitan statistical area) experienced the largest increase of job openings of all MSAs in the United States for the month of August with 386 new openings.

Month MSA Total_Openings New_Openings
Aug-14 New York-Northern New Jersey-Long Island, NY-NJ-PA 197,135 386

Source: BLS

Waiters and Waitresses experienced the largest increase of job openings nationwide for August

Waiters and waitresses experienced the largest increase of new openings of all occupations in the US for the month of August with 2,951 new job openings.

waiter

Month Occupation Total_Openings New_Openings
Aug-14 waiters and waitresses 57,761 2,951

Source: BLS

Image Source: http://www.clipartpanda.com/categories/waiter-20clipart

Working with large data sets: The new CMS medial records files

The new data files released by the CMS regarding the payments made to U.S. medical doctors by drug and medical device manufacturers contains a treasure trove of information.  However, the large size of the data will limit the use and the nuggets that can mined for some.

Using the statistical program STATA,  which is generally one of the fastest and most efficient ways to handle large data sets, required an allocation of 6G of RAM memory to just read in the program. STATA is efficient at handling large wage and hour, employment, and business data sets (like ones with many daily prices)

The table below shows what STATA required in terms of memory to be able to read the data:
Current memory allocation

current                                 memory usage
settable          value     description                 (1M = 1024k)
——————————————————————–
set maxvar         5000     max. variables allowed           1.947M
set memory         6144M    max. data space              6,144.000M
set matsize         400     max. RHS vars in models          1.254M
———–
6,147.201M


VA wait times are out of line but not that out of line with other types of hospitals

Overall, across established and new patients, VA wait times are actually not that out of line with other types of hospitals.

Highlights from the June 2014 VA wait time data,

Average VA wait time across hospitals and specialities: 22.78 days.

96% of VA patients have a wait time of 30 days or less to see a physician (significantly less for established patients (most less than 4 days))

Nearly 85% of 141 VA hospitals in the data have wait times less than 30 days

Longer wait times are concentrated in 15 out of 141 VA hospitals

In comparison, Merrit Hawkins 2014 study on hospital wait times for non-VA hospitals finds:

– Finds 18.5 day avg. wait times for all medical specialties, which is about 4 days shorter than wait times at VA hospitals

– Wait times vary significantly by location


Really long wait times at VA hospitals for established and new patients are concentrated at a few hospitals

Another preliminary finding from our research on VA wait times suggest that really long wait times at VA hospitals are concentrated at a few VA hospitals.  A significant amount of Vets (about 20%) are found at these hospitals with long wait times.

The graph below presents a histogram of VA wait times for Vets waiting more than 90 days for a new appoint

Histogramofwait times


Examining the distribution of industry payments made to medical doctors

The Center for Medical and Medicaid Services (CMS) new Open Payments database shows the consulting fees, research grants, travel and other reimbursements made to medical industry in 2013

There are 2,619,700 payments in the CMS data made to 356,190 physicians.   The average payment made to physicians was $255.22.   The median payment was $15.52

Table 1: Summary of Payments – STATA  output

table1


The physicians received an average total  of $1,877.11 in payments.  The median total payment for the 356,190 physicians in the data was $94.15

Table 2: Summary of Payments – STATA  output

tabl2


Below is the STATA code for the results:
count gen
bysort phy: gen hj =_n
bysort physician_p: gen hj =_n
sum hj, det
count if hj==1
sum tot, det
bysort physician_p: egen hj2 = tot(total)
bysort physician_p: egen hj2 = total(total_am)
sum hj2
sum hj2, det
sort physcian_p
sort physician_p
sum hj2 if _n==1, det
sum hj, det
sum hj2 if hj==1, det

Business interruption damages come in many different shapes and sizes

 download (3)
Business interruption cases come in many different shapes and sizes. In some business interruption cases the allegation is that the defendants’ actions increased the operating cost of the plaintiff.
For instance and one recent business interruption case the defendant’s drill and on-going construction activity unknowingly interfered with the plaintiffs’ fiber optic lines  drilling.
After the damaged lines were discovered by the plaintiff, the plaintiff spent a number of months fixing and creating new fiber optic lines. In addition to the out-of-pocket expense associated with the with the punctured fiber-optic lines, the plaintiffs also allege that they also incurred a correlated expense of having to use some of their existing employees to help mitigate the damage.
For instance, the plaintiff indicated that the mitigation of the damage caused by the defendant caused them to require substantial overtime hours from its employees to reestablish the lines and to maintain their service. The plaintiff after about eight months was able to get back up to speed and back to where there were prior to the incident.
In this case the alleged out-of-pocket expenses were relatively easy to determine. The company had to purchase more fiber optic and faced of the increased cost associated with installing those lines.
However the plaintiff also alleged that they experienced increased operating expenses, especially in terms of employee expenses.
Increased employee operating expenses is not always as straightforward to calculate. In this instance, employer did not necessarily hire more employees. Instead,  the employer used their existing employees at a higher level, required overtime, and shifted employees from one job or project to another. In these types of instances the employee expenses associated with the disruption is not so clear.
One way to determine damages in this case is to look at up is to use financial ratios. Financial ratios such as the employee expense to revenue ratio determine show how the company employs its employees.
For instance, a high employee expense ratio to revenue indicates that the company uses a lot of employees relevant relative to their revenue. A company with a high expense to revenue ratio is a relatively labor intensive company. Conversely, a company with a relatively low expense to revenue ratio is a relatively less employee intensive employer or company.
In a business interruption case, one approach is to look at the changes in these ratios both before and after the incident. Changes in these ratios can indicate the impact of the alleged actions. For instance the employee expense to revenue ratio could change dramatically following the alleged incident.
Other useful financial expense ratios include the full-time employee equivalent (FTE) ratios. FTE ratios are ratios that show how many full-time employees the company typically utilizes.  FTE measures take into account the part time work, overtime, and the different compensation structures that the company may utilize in its business.

Veteran’s wait time at VA hospital: A summary of our findings

Summary of our preliminary research of VA hospital wait times

VA hospital wait times have become an important issue in the U.S. as more and more Vets re-enter civilian life.  In our study, which we co-author with Economics Professor,  Dr. Peter Claeys of Universitat de Barcelona, we found the following preliminary results:

Overall, across established and new patients, VA wait times are actually not that out of line with other types of hospitals

The really long wait times for established and new patients are concentrated at a few hospitals

The major problem is getting enrolled

VA staffing levels matters 

In our upcoming posts we will expand on each of these points and make our data and program files available to interested researchers.

U.S. Commerce Department data show Internet retail sales continue to grow

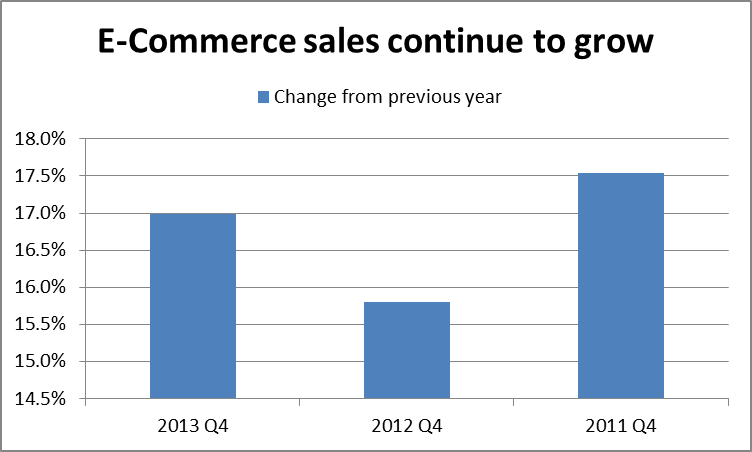
Retail sales over the internet continue to increase in the U.S.

Internet sales, or as the Commerce department puts it:  sales of goods and services where an order is placed by the buyer or price and terms of sale are negotiated over an Internet, extranet, Electronic Data Interchange (EDI) network electronic mail, or other online system, have increased over 15% each year of the last three years.

E-Commerce now makes up about 6% of all retail sales in the U.S.

Internetsales

Source: http://www2.census.gov/retail/releases/historical/ecomm/

Time Period E-commerce Sales Change from previous year
2013 Q4                83,709 17.0%
2012 Q4                71,554 15.8%
2011 Q4                61,789 17.5%
2010 Q4                52,567


.