All four of the largest Metropolitan Statistical Areas (MSAs) in Texas experienced a decrease in job openings from July 2015 to August 2015.
Dallas
Dallas experienced a decrease of 12,075 job openings from July 2015 to August 2015, a 10.54% decrease.
| Date | Total Openings | Monthly Change | Yearly Change |
| Aug-15 | 102,497 | -10.54% | 43.49% |
| Jul-15 | 114,572 | 16.84% | 27.63% |
| Jun-15 | 98,055 | -1.64% | 8.25% |
| May-15 | 99,685 | -6.84% | 17.59% |
| Apr-15 | 107,005 | 15.49% | 26.59% |
| Mar-15 | 92,653 | 2.87% | 3.43% |
| Feb-15 | 90,072 | -1.85% | 23.93% |
| Jan-15 | 91,770 | 38.18% | 29.39% |
| Dec-14 | 66,413 | -4.20% | -11.31% |
| Nov-14 | 69,326 | -10.74% | 11.28% |
| Oct-14 | 77,670 | 8.74% | 19.49% |
| Sep-14 | 71,430 | -20.43% | -6.57% |
Austin
Austin experienced a decrease of 5,002 job openings from July 2015 to August 2015, a 10.34% decrease.
| Date | Total Openings | Monthly Change | Yearly Change |
| Aug-15 | 43,395 | -10.34% | 34.13% |
| Jul-15 | 48,397 | 15.94% | 26.28% |
| Jun-15 | 41,742 | -1.41% | 7.20% |
| May-15 | 42,340 | -6.27% | 15.22% |
| Apr-15 | 45,170 | 14.25% | 24.68% |
| Mar-15 | 39,536 | 3.03% | 4.12% |
| Feb-15 | 38,372 | -1.78% | 23.78% |
| Jan-15 | 39,066 | 26.19% | 28.32% |
| Dec-14 | 30,957 | -1.84% | -2.14% |
| Nov-14 | 31,539 | -9.03% | 18.96% |
| Oct-14 | 34,670 | 7.17% | 24.53% |
| Sep-14 | 32,352 | -15.59% | -0.45% |
Houston
Houston experienced a decrease of 10,761 job openings from July 2015 to August 2015, a decrease of 10.58%.
| Date | Total Openings | Monthly Change | Yearly Change |
| Aug-15 | 90,902 | -10.58% | 42.04% |
| Jul-15 | 101,663 | 15.95% | 26.61% |
| Jun-15 | 87,680 | -1.05% | 7.20% |
| May-15 | 88,612 | -6.05% | 17.32% |
| Apr-15 | 94,317 | 14.01% | 24.76% |
| Mar-15 | 82,726 | 3.76% | 3.78% |
| Feb-15 | 79,730 | -2.12% | 20.96% |
| Jan-15 | 81,454 | 35.88% | 28.02% |
| Dec-14 | 59,945 | -3.04% | -10.92% |
| Nov-14 | 61,824 | -11.15% | 10.35% |
| Oct-14 | 69,582 | 8.73% | 19.68% |
| Sep-14 | 63,998 | -20.30% | -5.99% |
San Antonio
San Antonio has experienced a decrease of 4,229 job openings from July 2015 to August 2015, a decrease of 9.5%.
| Date | Total Openings | Monthly Change | Yearly Change |
| Aug-15 | 40,261 | -9.50% | 39.77% |
| Jul-15 | 44,490 | 16.80% | 22.88% |
| Jun-15 | 38,089 | -2.36% | 5.32% |
| May-15 | 39,009 | -7.10% | 14.34% |
| Apr-15 | 41,990 | 15.00% | 23.40% |
| Mar-15 | 36,512 | 2.73% | 1.38% |
| Feb-15 | 35,543 | -1.08% | 22.30% |
| Jan-15 | 35,932 | 34.70% | 26.88% |
| Dec-14 | 26,676 | -3.61% | -10.95% |
| Nov-14 | 27,676 | -11.80% | 12.69% |
| Oct-14 | 31,377 | 8.93% | 21.21% |
| Sep-14 | 28,805 | -20.44% | -4.98% |
Source: BLS
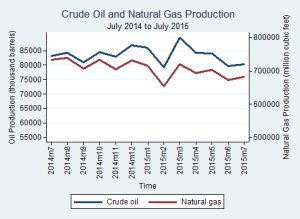
 The number of job openings in Texas for “petroleum engineers” and “geological and petroleum technicians” decreased from 635 in August 2015 to 653 in September 2015, while the searcher-to-job opening ratio decreased from 1.23 to 0.96 in the same span.
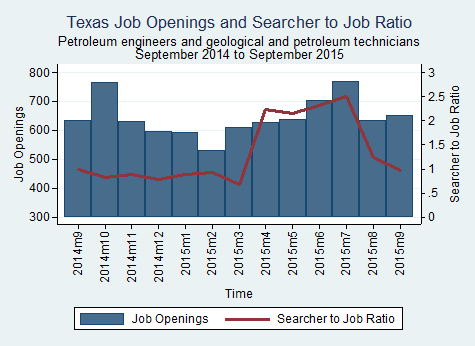


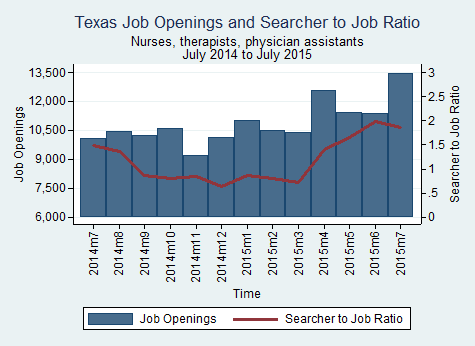
 The health care and social assistance industry gained 9,200 jobs from August 2015 to September 2015. Compared to September 2014, the cumulative number of jobs added in this industry is 67,000, an annual increase of 5.0%.